Apache Drill 源码分析1--准备工作,逻辑计划,物理计划
准备工作
修改logback.xml的日志级别为debug
<logger name="org.apache.drill" additivity="false"> <level value="debug" /> <appender-ref ref="FILE" /> </logger> <logger name="query.logger" additivity="false"> <level value="debug" /> <appender-ref ref="QUERY" /> </logger> <root> <level value="debug" /> <appender-ref ref="STDOUT" /> </root> 使用单机模式,而不是集群模式. 启动drill-embedded
除了在上面的drill-embedded观察输出, 还要观察log目录下的sqlline.log文件
2015-07-10 11:11:41,636 [main] DEBUG o.apache.drill.exec.server.Drillbit - Construction started. 2015-07-10 11:11:42,481 [main] INFO o.apache.drill.exec.server.Drillbit - Construction completed (845 ms). 2015-07-10 11:11:42,481 [main] DEBUG o.apache.drill.exec.server.Drillbit - Startup begun. 2015-07-10 11:11:42,481 [main] DEBUG o.a.d.e.c.l.LocalClusterCoordinator - Local Cluster Coordinator started. 2015-07-10 11:11:42,607 [main] DEBUG o.a.drill.exec.rpc.user.UserServer - Server of type UserServer started on port 31010. 2015-07-10 11:11:42,650 [main] DEBUG o.a.d.exec.rpc.control.ControlServer - Server of type ControlServer started on port 31011. 2015-07-10 11:11:42,688 [main] DEBUG o.a.drill.exec.rpc.data.DataServer - Server of type DataServer started on port 31012. 2015-07-10 11:11:42,924 [main] DEBUG o.a.drill.common.util.PathScanner - Classpath scanning took 60ms 2015-07-10 11:11:42,924 [main] DEBUG o.a.d.e.p.base.PhysicalOperatorUtil - Adding Physical Operator sub types: ................. 2015-07-10 11:11:43,047 [main] DEBUG org.apache.drill.common.JSONOptions - Creating Deserializer. 2015-07-10 11:11:43,146 [main] DEBUG o.a.d.e.p.i.OperatorCreatorRegistry - Adding Operator Creator map:.............. 2015-07-10 11:11:43,385 [main] DEBUG o.a.d.e.e.f.FunctionImplementationRegistry - Generating function registry. 2015-07-10 11:11:48,643 [main] DEBUG o.a.d.e.s.h.HBaseStoragePluginConfig - Initializing HBase StoragePlugin configuration with zookeeper quorum 'localhost', port '2181'. 2015-07-10 11:11:48,977 [main] DEBUG o.a.d.e.c.l.LocalClusterCoordinator - Endpoint registered address: "localhost" user_port: 31010 control_port: 31011 data_port: 31012 . 2015-07-10 11:11:51,700 [main] INFO o.apache.drill.exec.server.Drillbit - Startup completed (9218 ms). 2015-07-10 11:11:51,741 [main] DEBUG o.a.drill.exec.client.DrillClient - Connecting to server localhost:31010 可以看到命令行执行drill-embedded, 会连接到本地的Drill Server上.
在sqlline上执行一条SQL命令, 可以看到最终调用的是FragmentExecutor线程的run方法:
0: jdbc:drill:zk=local> select count(*) from cp.`employee.json`; 11:22:02.300 [2a60c5a4-e01a-ac02-84fd-a01023a1319a:foreman] DEBUG o.a.h.security.UserGroupInformation - PrivilegedAction as:zhengqh (auth:SIMPLE) from:org.apache.drill.exec.util.ImpersonationUtil.createFileSystem(ImpersonationUtil.java:141) 11:22:02.390 [2a60c5a4-e01a-ac02-84fd-a01023a1319a:frag:0:0] DEBUG o.a.h.security.UserGroupInformation - PrivilegedAction as:zhengqh (auth:SIMPLE) from:org.apache.drill.exec.work.fragment.FragmentExecutor.run(FragmentExecutor.java:255) +---------+ | EXPR$0 | +---------+ | 1155 | +---------+ 1 row selected (0.221 seconds) 日志分析
sqlline.log日志我们一段一段地分析
首先注册查询语句, 即在sqlline输入的sql语句, 会分配一个query-id. 访问 http://localhost:8047/profiles 可以找到这个Query Job.
2015-07-10 11:22:02,257 [main] DEBUG o.a.d.j.impl.DrillStatementRegistry - Adding to open-statements registry: org.apache.drill.jdbc.impl.DrillStatementImpl@4eb2bb3d 2015-07-10 11:22:02,258 [main] DEBUG o.a.d.j.i.DrillResultSetImpl$ResultsListener - [#3] Query listener created. 2015-07-10 11:22:02,259 [UserServer-1] DEBUG o.a.drill.exec.rpc.user.UserServer - Received query to run. Returning query handle. 2015-07-10 11:22:02,273 [UserServer-1] DEBUG o.a.d.exec.memory.TopLevelAllocator - New child allocator with initial reservation 1048576 2015-07-10 11:22:02,274 [UserServer-1] DEBUG o.a.drill.exec.rpc.user.UserServer - Sending response with Sender 575856913 2015-07-10 11:22:02,275 [Client-1] DEBUG o.a.d.j.i.DrillResultSetImpl$ResultsListener - [#3] Received query ID: 2a60c5a4-e01a-ac02-84fd-a01023a1319a. 2015-07-10 11:22:02,276 [Client-1] DEBUG o.a.d.e.rpc.user.QueryResultHandler - Received QueryId 2a60c5a4-e01a-ac02-84fd-a01023a1319a successfully. Adding results listener org.apache.drill.jdbc.impl.DrillResultSetImpl$ResultsListener@6f3634b1. 使用了Optiq生成Logical逻辑计划, 查看SQL语句对应的逻辑计划/物理计划是从下到上的, 比如下面的TableScan->Project->Aggregate
对于 SELECT COUNT(COLUMN) FOME TABLE , 实际上逻辑计划的顺序是:
FROM TABLE(TableScan扫描) -> SELECT COLUMN(Project映射) -> COUNT(Aggregate聚合计算)
2015-07-10 11:22:02,315 [2a60c5a4-e01a-ac02-84fd-a01023a1319a:foreman] DEBUG o.a.d.e.p.s.h.DefaultSqlHandler - Optiq Logical : LogicalAggregate(group=[{}], EXPR$0=[COUNT()]): rowcount = 10.0, cumulative cost = {211.25 rows, 201.0 cpu, 0.0 io, 0.0 network, 0.0 memory}, id = 211 LogicalProject($f0=[0]): rowcount = 100.0, cumulative cost = {200.0 rows, 201.0 cpu, 0.0 io, 0.0 network, 0.0 memory}, id = 209 EnumerableTableScan(table=[[cp, employee.json]]): rowcount = 100.0, cumulative cost = {100.0 rows, 101.0 cpu, 0.0 io, 0.0 network, 0.0 memory}, id = 205 Optiq的逻辑计划最终会形成Drill的逻辑计划,再到Drill的物理计划: Drill Logial -> Drill Physical的过程
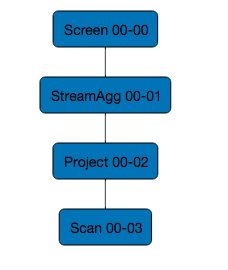
2015-07-10 11:22:02,320 [2a60c5a4-e01a-ac02-84fd-a01023a1319a:foreman] DEBUG o.a.d.e.s.schedule.BlockMapBuilder - Took 0 ms to build endpoint map 2015-07-10 11:22:02,323 [2a60c5a4-e01a-ac02-84fd-a01023a1319a:foreman] DEBUG o.a.d.e.s.schedule.BlockMapBuilder - FileWork group (classpath:/employee.json,0) max bytes 474631 2015-07-10 11:22:02,323 [2a60c5a4-e01a-ac02-84fd-a01023a1319a:foreman] DEBUG o.a.d.e.s.schedule.BlockMapBuilder - Took 2 ms to set endpoint bytes 2015-07-10 11:22:02,323 [2a60c5a4-e01a-ac02-84fd-a01023a1319a:foreman] INFO o.a.d.e.s.schedule.BlockMapBuilder - Get block maps: Executed 1 out of 1 using 1 threads. Time: 2ms total, 2.240000ms avg, 2ms max. 2015-07-10 11:22:02,323 [2a60c5a4-e01a-ac02-84fd-a01023a1319a:foreman] INFO o.a.d.e.s.schedule.BlockMapBuilder - Get block maps: Executed 1 out of 1 using 1 threads. Earliest start: 1.000000 μs, Latest start: 1.000000 μs, Average start: 1.000000 μs . 2015-07-10 11:22:02,324 [2a60c5a4-e01a-ac02-84fd-a01023a1319a:foreman] DEBUG o.a.d.e.s.schedule.AffinityCreator - Work: [File: classpath:/employee.json start: 0 length: 474630] Endpoint: localhost Bytes: 474630 2015-07-10 11:22:02,324 [2a60c5a4-e01a-ac02-84fd-a01023a1319a:foreman] DEBUG o.a.d.e.s.schedule.AffinityCreator - Endpoint localhost has affinity 1.0 2015-07-10 11:22:02,324 [2a60c5a4-e01a-ac02-84fd-a01023a1319a:foreman] DEBUG o.a.d.e.s.schedule.AffinityCreator - Took 0 ms to get operator affinity 2015-07-10 11:22:02,329 [2a60c5a4-e01a-ac02-84fd-a01023a1319a:foreman] DEBUG o.a.d.e.p.s.h.DefaultSqlHandler - VolCalciteRel : 2015-07-10 11:22:02,331 [2a60c5a4-e01a-ac02-84fd-a01023a1319a:foreman] DEBUG o.a.d.e.p.s.h.DefaultSqlHandler - HepCalciteRel : 2015-07-10 11:22:02,333 [2a60c5a4-e01a-ac02-84fd-a01023a1319a:foreman] DEBUG o.a.d.e.p.s.h.DefaultSqlHandler - Drill Logical : DrillScreenRel: rowcount = 1.0, cumulative cost = {927.1 rows, 1853.1 cpu, 0.0 io, 0.0 network, 0.0 memory}, id = 239 DrillAggregateRel(group=[{}], EXPR$0=[COUNT()]): rowcount = 1.0, cumulative cost = {927.0 rows, 1853.0 cpu, 0.0 io, 0.0 network, 0.0 memory}, id = 236 DrillProjectRel($f0=[0]): rowcount = 463.0, cumulative cost = {926.0 rows, 1852.0 cpu, 0.0 io, 0.0 network, 0.0 memory}, id = 234 DrillScanRel(table=[[cp, employee.json]], groupscan=[EasyGroupScan [selectionRoot=classpath:/employee.json, numFiles=1, columns=[`*`], files=[classpath:/employee.json]]]): rowcount = 463.0, cumulative cost = {463.0 rows, 0.0 cpu, 0.0 io, 0.0 network, 0.0 memory}, id = 222 2015-07-10 11:22:02,368 [2a60c5a4-e01a-ac02-84fd-a01023a1319a:foreman] DEBUG o.a.d.e.p.s.h.DefaultSqlHandler - Drill Physical : 00-00 Screen : rowType = RecordType(BIGINT EXPR$0): rowcount = 1.0, cumulative cost = {1389.1 rows, 7408.1 cpu, 0.0 io, 0.0 network, 0.0 memory}, id = 317 00-01 StreamAgg(group=[{}], EXPR$0=[COUNT()]) : rowType = RecordType(BIGINT EXPR$0): rowcount = 1.0, cumulative cost = {1389.0 rows, 7408.0 cpu, 0.0 io, 0.0 network, 0.0 memory}, id = 316 00-02 Project($f0=[0]) : rowType = RecordType(INTEGER $f0): rowcount = 463.0, cumulative cost = {926.0 rows, 1852.0 cpu, 0.0 io, 0.0 network, 0.0 memory}, id = 315 00-03 Scan(groupscan=[EasyGroupScan [selectionRoot=classpath:/employee.json, numFiles=1, columns=[`*`], files=[classpath:/employee.json]]]) : rowType = RecordType(): rowcount = 463.0, cumulative cost = {463.0 rows, 0.0 cpu, 0.0 io, 0.0 network, 0.0 memory}, id = 314 访问 http://localhost:8047/profiles/2a60c5a4-e01a-ac02-84fd-a01023a1319a 查看这个作业的物理计划
可以看到物理计划从下到上的顺序是: Scan->Project->StreamAgg. 因为物理计划实际上是从逻辑计划计算出来的.
然后会输出详细的json格式的计划. graph有几个字段pop代表操作类型,@id是编号,child是VisualizedPlan树从上到下第几层.
graph域的fs-scan代表扫描文件系统,扫描所有列*; project映射字段,$f0实际上就是columns中的第一个字段;
streaming-aggregate的计算表达式count(1), 最后通过screen输出
我们先看一下Web页面的可视化计划数, 先来个比较直观的映象以Scan 00-03为例,00是major id,03是fs-scan的@id=3
下面不同的pop,对应的metadata也不一样, 比如project映射需要表达式,因为选择一个列,是可以在列上做计算的
2015-07-10 11:22:02,370 [2a60c5a4-e01a-ac02-84fd-a01023a1319a:foreman] DEBUG o.a.d.e.p.s.h.DefaultSqlHandler - Drill Plan : { "head" : { "version" : 1, "generator" : { "type" : "DefaultSqlHandler", "info" : "" }, "type" : "APACHE_DRILL_PHYSICAL", "options" : [ ], "queue" : 0, "resultMode" : "EXEC" }, "graph" : [ { "pop" : "fs-scan", "@id" : 3, "userName" : "zhengqh", "files" : [ "classpath:/employee.json" ], ... "columns" : [ "`*`" ], "selectionRoot" : "classpath:/employee.json", }, { "pop" : "project", "@id" : 2, "exprs" : [ { "ref" : "`$f0`", "expr" : "0" } ], "child" : 3 }, { "pop" : "streaming-aggregate", "@id" : 1, "child" : 2, "keys" : [ ], "exprs" : [ { "ref" : "`EXPR$0`", "expr" : "count(1) " } ] }, { "pop" : "screen", "@id" : 0, "child" : 1 } ] } Drill的执行引擎会将逻辑计划组成一个Fragment树. 下面是Root Fragment.
对照WebUI, 这个Query在本地测试时,只生成了一个Fragment.
Root Fragment的major和minor id都是0. 下面的fragment_json和上面graph不同的是它是嵌套的.
为什么可视化的Plan对应的graph是扁平的,而Root Fragment是嵌套的?
可以这么理解: 如果图的结构是嵌套的,那么就要在Screen这个组件里画上streaming-aggregate
并在streaming-aggregate里再画上project,以此类推,就不叫图了,图是一个DAG有向无环图.
而树如果是扁平的,则只能像上面的图一样一直下去,没有分支. 使用嵌套,就有了分支的概念了.
2015-07-10 11:22:02,372 [2a60c5a4-e01a-ac02-84fd-a01023a1319a:foreman] DEBUG o.a.d.e.s.schedule.AssignmentCreator - Took 0 ms to assign 1 work units to 1 fragments 2015-07-10 11:22:02,378 [2a60c5a4-e01a-ac02-84fd-a01023a1319a:foreman] DEBUG o.a.d.e.p.f.SimpleParallelizer - Root fragment: handle { query_id { part1: 3053657859282349058 part2: -8863752500417580646 } major_fragment_id: 0 minor_fragment_id: 0 } fragment_json: "{ "pop" : "screen", "@id" : 0, "child" : { "pop" : "streaming-aggregate", "@id" : 1, "child" : { "pop" : "project", "@id" : 2, "exprs" : [ { "ref" : "`$f0`", "expr" : "0" } ], "child" : { "pop" : "fs-sub-scan", "@id" : 3, "userName" : "zhengqh", "files" : [ { "start" : 0, "length" : 474630, "path" : "classpath:/employee.json" } ], "columns" : [ "`*`" ], "selectionRoot" : "classpath:/employee.json" }, "initialAllocation" : 1000000, "maxAllocation" : 10000000000, "cost" : 463.0 }, "keys" : [ ], "exprs" : [ { "ref" : "`EXPR$0`", "expr" : "count(1) " } ] } }" leaf_fragment: true assignment { address: "localhost" user_port: 31010 control_port: 31011 data_port: 31012 } foreman { address: "localhost" user_port: 31010 control_port: 31011 data_port: 31012 } mem_initial: 3000000 mem_max: 30000000000 credentials { user_name: "anonymous" } options_json: "[ ]" context { query_start_time: 1436498522273 time_zone: 299 default_schema_name: "" } 上面和fragment_json同级的还有foreman,表示接受客户端查询作业的节点, 因为是本地模式,所以是localhost.初始化内存mem_initial和最大内存mem_max在FragmentContext中.
Fragment提交到Foreman后, 查询开始运行, Foreman的状态从PENDING到RUNNING, FragmentExecutor从AWAITING_ALLOCATION到RUNNING.这里有个比较重要的概念是通过ImplCreator创建的RecordBatch Tree.
上面我们已经有了Root Fragment形成的Tree的概念. 这里批记录还有树.什么是RecordBatch,顾名思义是批记录. 那为什么又有树的概念?
2015-07-10 11:22:02,378 [2a60c5a4-e01a-ac02-84fd-a01023a1319a:foreman] DEBUG o.a.d.exec.rpc.control.WorkEventBus - Adding fragment status listener for queryId 2a60c5a4-e01a-ac02-84fd-a01023a1319a. 2015-07-10 11:22:02,378 [2a60c5a4-e01a-ac02-84fd-a01023a1319a:foreman] DEBUG o.a.drill.exec.work.foreman.Foreman - Submitting fragments to run. 2015-07-10 11:22:02,378 [2a60c5a4-e01a-ac02-84fd-a01023a1319a:foreman] DEBUG o.a.drill.exec.ops.FragmentContext - Getting initial memory allocation of 3000000 2015-07-10 11:22:02,378 [2a60c5a4-e01a-ac02-84fd-a01023a1319a:foreman] DEBUG o.a.drill.exec.ops.FragmentContext - Fragment max allocation: 30000000000 2015-07-10 11:22:02,378 [2a60c5a4-e01a-ac02-84fd-a01023a1319a:foreman] DEBUG o.a.d.exec.memory.TopLevelAllocator - New child allocator with initial reservation 3000000 2015-07-10 11:22:02,379 [2a60c5a4-e01a-ac02-84fd-a01023a1319a:foreman] DEBUG o.a.d.e.work.batch.IncomingBuffers - Came up with a list of 0 required fragments. Fragments {} 2015-07-10 11:22:02,380 [2a60c5a4-e01a-ac02-84fd-a01023a1319a:foreman] INFO o.a.drill.exec.work.foreman.Foreman - State change requested. PENDING --> RUNNING 2015-07-10 11:22:02,381 [2a60c5a4-e01a-ac02-84fd-a01023a1319a:foreman] DEBUG o.a.drill.exec.work.foreman.Foreman - Fragments running. 2015-07-10 11:22:02,381 [2a60c5a4-e01a-ac02-84fd-a01023a1319a:frag:0:0] DEBUG o.a.d.exec.memory.BufferAllocator - New child allocator with initial reservation 1000000 2015-07-10 11:22:02,387 [2a60c5a4-e01a-ac02-84fd-a01023a1319a:frag:0:0] DEBUG o.a.d.exec.memory.BufferAllocator - New child allocator with initial reservation 1000000 2015-07-10 11:22:02,387 [2a60c5a4-e01a-ac02-84fd-a01023a1319a:frag:0:0] DEBUG o.a.d.exec.memory.BufferAllocator - New child allocator with initial reservation 1000000 2015-07-10 11:22:02,388 [2a60c5a4-e01a-ac02-84fd-a01023a1319a:frag:0:0] DEBUG o.a.d.exec.memory.BufferAllocator - New child allocator with initial reservation 1000000 2015-07-10 11:22:02,388 [2a60c5a4-e01a-ac02-84fd-a01023a1319a:frag:0:0] DEBUG o.a.d.exec.physical.impl.ImplCreator - Took 7 ms to create RecordBatch tree 2015-07-10 11:22:02,388 [2a60c5a4-e01a-ac02-84fd-a01023a1319a:frag:0:0] INFO o.a.d.e.w.fragment.FragmentExecutor - 2a60c5a4-e01a-ac02-84fd-a01023a1319a:0:0: State change requested from AWAITING_ALLOCATION --> RUNNING for 2015-07-10 11:22:02,388 [2a60c5a4-e01a-ac02-84fd-a01023a1319a:frag:0:0] INFO o.a.d.e.w.f.AbstractStatusReporter - State changed for 2a60c5a4-e01a-ac02-84fd-a01023a1319a:0:0. New state: RUNNING Fragment的状态会被QueryManager管理, 其中operator_profile是操作算子的选项, 包括了一些字段input_profile, 操作算子id, 操作类型等等.
什么是profile, 其实WEB页面 http://localhost:8047/profiles 就是Drill查询作业运行时的profile收集页面.
包括了Query Profile, Fragment Profiles,Operator Profiles,Full JSON Profile.
2015-07-10 11:22:02,389 [2a60c5a4-e01a-ac02-84fd-a01023a1319a:frag:0:0] DEBUG o.a.d.e.w.f.NonRootStatusReporter - Sending status change message message to remote node: profile { state: RUNNING minor_fragment_id: 0 operator_profile { input_profile { records: 0 batches: 0 schemas: 0 } operator_id: 3 operator_type: 29 setup_nanos: 0 process_nanos: 4651000 peak_local_memory_allocated: 0 wait_nanos: 3000 } ... 2015-07-10 11:22:02,390 [2a60c5a4-e01a-ac02-84fd-a01023a1319a:frag:0:0] DEBUG o.a.d.e.w.fragment.FragmentExecutor - Starting fragment 0:0 on localhost:31010 2015-07-10 11:22:02,392 [BitServer-4] DEBUG o.a.d.exec.work.foreman.QueryManager - New fragment status was provided to QueryManager of profile { 上面提到的RecordBatch在下面有几个实现类: ProjectRecordBatch, StreamingAggBatch.
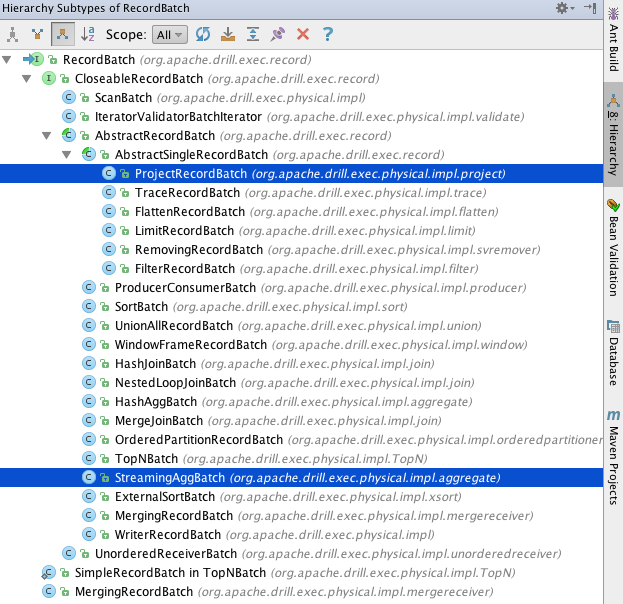
2015-07-10 11:22:02,392 [BitServer-4] DEBUG o.a.d.exec.rpc.control.ControlServer - Sending response with Sender 762133699 2015-07-10 11:22:02,408 [2a60c5a4-e01a-ac02-84fd-a01023a1319a:frag:0:0] DEBUG o.a.d.e.p.i.p.ProjectRecordBatch - Added eval for project expression. 2015-07-10 11:22:02,410 [2a60c5a4-e01a-ac02-84fd-a01023a1319a:frag:0:0] DEBUG o.a.d.e.p.i.a.StreamingAggBatch - Creating new aggregator. 2015-07-10 11:22:02,413 [2a60c5a4-e01a-ac02-84fd-a01023a1319a:frag:0:0] DEBUG o.a.d.e.p.i.a.StreamingAggBatch - Next outcome of OK_NEW_SCHEMA 2015-07-10 11:22:02,413 [2a60c5a4-e01a-ac02-84fd-a01023a1319a:frag:0:0] DEBUG o.a.d.e.p.i.a.StreamingAggBatch - Creating new aggregator. +++++++++++++batch1+++++++++++++ 2015-07-10 11:22:02,414 [Client-1] DEBUG o.a.d.e.rpc.user.QueryResultHandler - batchArrived: queryId = part1: 3053657859282349058 part2: -8863752500417580646 2015-07-10 11:22:02,415 [Client-1] DEBUG o.a.d.j.i.DrillResultSetImpl$ResultsListener - [#3] Received query data batch #1: QueryResultBatch [header=query_id { 2015-07-10 11:22:02,415 [Client-1] DEBUG o.a.drill.exec.rpc.user.UserClient - Sending response with Sender 955795882 2015-07-10 11:22:02,416 [main] DEBUG o.a.d.j.i.DrillResultSetImpl$ResultsListener - [#3] Dequeued query data batch #1: QueryResultBatch [header=query_id { 上面的batchArrived表示批记录到来, 那么接下去就是处理到来的数据了:
对于batch, 总是先 Received query data batch , 然后 Sending response with Sender ,
最后 Dequeued query data batch . 很显然query data batch会在队列中进进出出.
+++++++++++++batch2+++++++++++++ 2015-07-10 11:22:02,419 [2a60c5a4-e01a-ac02-84fd-a01023a1319a:frag:0:0] DEBUG o.a.d.e.p.i.a.StreamingAggBatch - Aggregator response RETURN_OUTCOME, records 1 2015-07-10 11:22:02,419 [2a60c5a4-e01a-ac02-84fd-a01023a1319a:frag:0:0] DEBUG o.a.d.e.p.i.a.StreamingAggBatch - Aggregator response CLEANUP_AND_RETURN, records 1 2015-07-10 11:22:02,421 [Client-1] DEBUG o.a.d.e.rpc.user.QueryResultHandler - batchArrived: queryId = part1: 3053657859282349058 part2: -8863752500417580646 2015-07-10 11:22:02,421 [Client-1] DEBUG o.a.d.j.i.DrillResultSetImpl$ResultsListener - [#3] Received query data batch #2: QueryResultBatch [header=query_id { 2015-07-10 11:22:02,421 [Client-1] DEBUG o.a.drill.exec.rpc.user.UserClient - Sending response with Sender 1000578767 2015-07-10 11:22:02,422 [main] DEBUG o.a.d.j.i.DrillResultSetImpl$ResultsListener - [#3] Dequeued query data batch #2: QueryResultBatch [header=query_id { 计算完成, 关闭上下文, FragmentExecutor的状态从RUNNING到FINISHED. 同样也会打印profile.这里我们终于看到了1155这个Query计算出来的结果了.
2015-07-10 11:22:02,423 [2a60c5a4-e01a-ac02-84fd-a01023a1319a:frag:0:0] DEBUG o.a.d.exec.ops.OperatorContextImpl - Closing context for org.apache.drill.exec.store.dfs.easy.EasySubScan 2015-07-10 11:22:02,423 [2a60c5a4-e01a-ac02-84fd-a01023a1319a:frag:0:0] DEBUG o.a.d.exec.ops.OperatorContextImpl - Closing context for org.apache.drill.exec.physical.config.Project 2015-07-10 11:22:02,423 [2a60c5a4-e01a-ac02-84fd-a01023a1319a:frag:0:0] DEBUG o.a.d.exec.ops.OperatorContextImpl - Closing context for org.apache.drill.exec.physical.config.StreamingAggregate 2015-07-10 11:22:02,423 [2a60c5a4-e01a-ac02-84fd-a01023a1319a:frag:0:0] DEBUG o.a.d.exec.ops.OperatorContextImpl - Closing context for org.apache.drill.exec.physical.config.Screen 2015-07-10 11:22:02,423 [2a60c5a4-e01a-ac02-84fd-a01023a1319a:frag:0:0] DEBUG o.apache.drill.exec.memory.Accountor - Fragment 0:0 accountor being closed 2015-07-10 11:22:02,423 [2a60c5a4-e01a-ac02-84fd-a01023a1319a:frag:0:0] INFO o.a.d.e.w.fragment.FragmentExecutor - 2a60c5a4-e01a-ac02-84fd-a01023a1319a:0:0: State change requested from RUNNING --> FINISHED for 2015-07-10 11:22:02,423 [2a60c5a4-e01a-ac02-84fd-a01023a1319a:frag:0:0] INFO o.a.d.e.w.f.AbstractStatusReporter - State changed for 2a60c5a4-e01a-ac02-84fd-a01023a1319a:0:0. New state: FINISHED 2015-07-10 11:22:02,424 [2a60c5a4-e01a-ac02-84fd-a01023a1319a:frag:0:0] DEBUG o.a.d.e.w.f.NonRootStatusReporter - Sending status change message message to remote node: profile { state: FINISHED minor_fragment_id: 0 operator_profile { input_profile { records: 1155 batches: 1 schemas: 1 } operator_id: 3 operator_type: 29 setup_nanos: 0 process_nanos: 22301000 peak_local_memory_allocated: 4608 wait_nanos: 133000 } ... 最后Forman也会关闭, Foreman的状态从RUNNING到COMPLETED. 打印resultArrived的时候其实结果已经在sqlline上输出了.剩下就是一些资源移除,注销之类的工作了. 其实和最开始的资源申请,注册是对应的.
2015-07-10 11:22:02,427 [BitServer-4] INFO o.a.drill.exec.work.foreman.Foreman - State change requested. RUNNING --> COMPLETED 2015-07-10 11:22:02,427 [BitServer-4] INFO o.a.drill.exec.work.foreman.Foreman - foreman cleaning up. 2015-07-10 11:22:02,429 [BitServer-4] DEBUG o.a.d.exec.rpc.control.WorkEventBus - Removing fragment status listener for queryId 2a60c5a4-e01a-ac02-84fd-a01023a1319a. 2015-07-10 11:22:02,430 [BitServer-4] DEBUG o.apache.drill.exec.memory.Accountor - Fragment 0:0 accountor being closed 2015-07-10 11:22:02,446 [BitServer-4] DEBUG o.a.d.exec.rpc.control.ControlServer - Sending response with Sender 739019148 2015-07-10 11:22:02,447 [Client-1] DEBUG o.a.d.e.rpc.user.QueryResultHandler - resultArrived: queryState: COMPLETED, queryId = part1: 3053657859282349058 part2: -8863752500417580646 2015-07-10 11:22:02,448 [Client-1] DEBUG o.a.d.j.i.DrillResultSetImpl$ResultsListener - [#3] Received query completion: COMPLETED. 2015-07-10 11:22:02,448 [Client-1] DEBUG o.a.drill.exec.rpc.user.UserClient - Sending response with Sender 264929084 2015-07-10 11:22:02,479 [main] DEBUG o.a.d.j.i.DrillResultSetImpl$ResultsListener - [#3] Query listener closing. 2015-07-10 11:22:02,479 [main] DEBUG o.a.d.j.impl.DrillStatementRegistry - Removing from open-statements registry: org.apache.drill.jdbc.impl.DrillStatementImpl@4eb2bb3d Logical Plan逻辑计划
http://drill.apache.org/docs/drill-plan-syntax/
https://docs.google.com/document/d/1QTL8warUYS2KjldQrGUse7zp8eA72VKtLO...
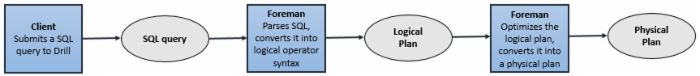
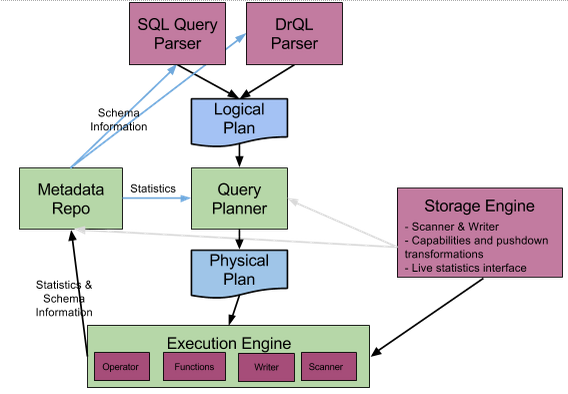
http://yangyoupeng-cn-fujitsu-com.iteye.com/blog/1971728在Architecture中我们见到这张图了
在DesignDoc中是一张比较粗略的图
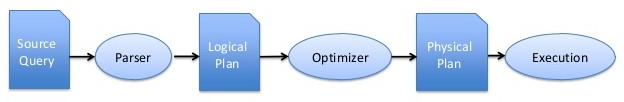
总的来说过程就是: 查询语句--解析器--逻辑计划--优化器--物理计划--执行引擎
关于逻辑计划比较详细的文档也给出了(上面第二个链接,请自行fq).
以Logical Plan Operators的Scan为例
The Scan operator outputs a stream of records. The "storageengine" argument must refer by name to a storage engine defined in the engines clause of the logical plan. The "selection" argument accepts a JSON object that is used by the data source itself to limit the amount of data actually retrieved. The format and content of this object is specific to the actual input source being used. Examples might include an HBase table name, a MongoDB collection, an HDFS path or a partition of a Hive table. Data sources will use the the selection argument in an implementation-specific way. The provided “ref” argument ensures that all records within the scanned source are held in the provided namespace.
{ @id†: < opref >, op: “scan”,
storageengine: < string >,
selection*: < json >,
ref: < name >
}
Scan操作算子会输出记录流. 参数storageengine必须引用逻辑计划中定义的engine声明.
selection参数接收JSON对象,会被数据源使用,用于限制接收到的数据的数量.
这个JSON对象的格式和内容和实际的数据源有关.比如HBase的表名,MongoDB的集合,HDFS的路径,或者Hive表的一个分区.
Talk is cheap, Show me the Code.
在 org.apache.drill.common.logical.data 有很多上文提到的算子比如Scan,Join,Project,Union等.
@JsonTypeName("scan") public class Scan extends SourceOperator { private final String storageEngine; private final JSONOptions selection; @JsonCreator public Scan(@JsonProperty("storageengine") String storageEngine, @JsonProperty("selection") JSONOptions selection) { super(); this.storageEngine = storageEngine; this.selection = selection; } @JsonProperty("storageengine") public String getStorageEngine() { return storageEngine; } public JSONOptions getSelection() { return selection; } @Override public <T, X, E extends Throwable> T accept(LogicalVisitor<T, X, E> logicalVisitor, X value) throws E { return logicalVisitor.visitScan(this, value); } } LogicalVisitor 是逻辑(算子)的访问器. Visitor class designed to traversal of a operator tree. 遍历一颗操作算子树
Basis for a number of operator manipulations including fragmentation and materialization. 对算子的维护包括分片,序列化
Scan操作比较简单, 它继承的是SourceOperator:An operator that produces data without any parents. (zero input operator)
Operator分成若干类,每一个operator都标示了它的类型,目前operator类包括:
0:可以产生不依赖其他operator的数据,类似于源数据. 比如Scan,
1:该operator可以处理一个单独input source, 比如Project,Order,Limit等
M:可以处理多个input source数据
K:该operator不会产生输出。
我们知道Project包括字段和表达式, 比如count( ), 其中 是ref引用,count是expr表达式
@JsonTypeName("project") public class Project extends SingleInputOperator { private final NamedExpression[] selections; @JsonPropertyOrder({"ref", "expr"}) public class NamedExpression { private final LogicalExpression expr; private final FieldReference ref; 在org.apache.drill.common.logical这个包下有个比较重要的类LogicalPlan,先来看看Plan的属性有哪些
public class PlanProperties { public static enum PlanType {APACHE_DRILL_LOGICAL, APACHE_DRILL_PHYSICAL} public PlanType type; public int version; public Generator generator; public ResultMode resultMode; public JSONOptions options; public int queue; public static class Generator { public String type; public String info; public static enum ResultMode { EXEC, LOGICAL, PHYSICAL; } private Generator(@JsonProperty("type") String type, @JsonProperty("info") String info) { this.type = type; this.info = info; } } 对应了前面的Drill Plan中head部分的输出(虽然前面我们看到的Drill Plan应该是物理计划,而不是逻辑计划,但是head部分是一样的)
{ "head" : { "version" : 1, "generator" : { "type" : "DefaultSqlHandler", "info" : "" }, "type" : "APACHE_DRILL_PHYSICAL", "options" : [ ], "queue" : 0, "resultMode" : "EXEC" }, PhysicalPlan物理计划
怎么知道前面日志中打印的Drill Plan是物理计划,而不是逻辑计划, 首先可以从调用的类DefaultSqlHandler,搜索Drill Plan
public PhysicalPlan getPlan(SqlNode sqlNode) { final ConvertedRelNode convertedRelNode = validateAndConvert(sqlNode); final RelDataType validatedRowType = convertedRelNode.getValidatedRowType(); final RelNode queryRelNode = convertedRelNode.getConvertedNode(); log("Optiq Logical", queryRelNode, logger); DrillRel drel = convertToDrel(queryRelNode, validatedRowType); log("Drill Logical", drel, logger); Prel prel = convertToPrel(drel); log("Drill Physical", prel, logger); PhysicalOperator pop = convertToPop(prel); PhysicalPlan plan = convertToPlan(pop); log("Drill Plan", plan, logger); return plan; } 1.可以看到在上面的getPlan方法中, 依次生成的计划是: Optiq逻辑计划-->Drill逻辑计划-->Drill物理计划
2.物理计划和逻辑计划一样也有很多operator, 都在 org.apache.drill.exec.physical 包下
3.Optiq现在变成Apache的Calcite, 入门教程: http://blog.csdn.net/yunlong34574/article/details/46375733
getPlan调用树是被Foreman线程运行,由Foreman创建的DrillSqlWorker调用执行的.
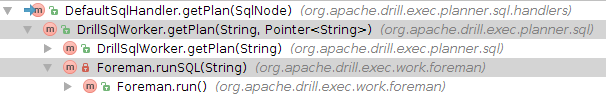
真正运行物理计划,还是在Foreman的runPhysicalPlan中
private void runSQL(final String sql) throws ExecutionSetupException { final DrillSqlWorker sqlWorker = new DrillSqlWorker(queryContext); final Pointer<String> textPlan = new Pointer<>(); final PhysicalPlan plan = sqlWorker.getPlan(sql, textPlan); queryManager.setPlanText(textPlan.value); runPhysicalPlan(plan); } Foreman与Query的生命周期
Foreman线程的run方法中的queryRequest是org.apache.drill.exec.proto.UserProtos的RunQuery
可以认为就是用户输入的查询语句,只不过由于是分布式,客户端输入的查询,会通过RPC在Foreman上执行
protobuffer文件的定义在drill-protocol/src/main/protobuf下,比如User.proto对应了UserProtos
关键看下run()上面的注释. 什么时候被调用: 在查询建立起来的时候
以什么样的方式调用: 执行线程池. 功能是什么: 完成远程执行
注意这个方法的结束并不代表查询生命周期的Foreman角色的结束.
Called by execution pool to do query setup, and kick off remote execution.Note that completion of this function is not the end of the Foreman's role in the query's lifecycle.
正文到此结束
- 本文标签: 源码 js zookeeper SDN Document 参数 classpath https HBase Google 遍历 入门教程 测试 struct HDFS 管理 解析 list root ip 集群 IDE MongoDB value web db cat 数据 App key apache node 线程 UI Apache Drill XML java remote tar map CEO json 目录 tab sql 注释 Select final
- 版权声明: 本文为互联网转载文章,出处已在文章中说明(部分除外)。如果侵权,请联系本站长删除,谢谢。
- 本文海报: 生成海报一 生成海报二
热门推荐


相关文章

近期评论
-
你这基本没有更新呀,最近文章显示还是2019年的文章。不符合要求哈
-
关键词:慕云博客 链接:https://www.lilun.me 描述:分享原创文字的个人博客
-
-
-
可以提供一下源码吗
-
不是商业站,鸡娃学习笔记
-
-
-
-
听他们说很厉害的样子
Loading...
![[HBLOG]公众号](http://www.liuhaihua.cn/img/qrcode_gzh.jpg)

