脚本绘图工具总结
我们总是要写各种文档,演示各种PPT,写各种博客,其中都少不了需要作出一些图形,用于形象的展示出想要表达的信息。Windows自带的画图、Paint.Net,Visio、Rose等各种工具,只要有足够的耐心,并且对这些工具足够熟悉,都可以做出各种强大、各种类型的图形。
但是我作为程序员,非常不擅长这种用鼠标操作的作图工具,迫切需要一款用键盘敲出来的脚本绘图工具,就像写文档时,不喜欢用Word而是用Markdown一样。
经过了解,总算是找到了一些这样的工具,下面分别介绍一下。
graphviz
Graphviz 是一个可以创建图表的灵活应用程序,可以轻松实现脚本化。Graphviz主要使用Dot脚本语言来控制输出的图形,如下:
digraph G { subgraph cluster0 { node [style=filled,color=white]; style=filled; color=lightgrey; a0 -> a1 -> a2 -> a3; label = "process #1"; } subgraph cluster1 { node [style=filled]; b0 -> b1 -> b2 -> b3; label = "process #2"; color=blue } start -> a0; start -> b0; a1 -> b3; b2 -> a3; a3 -> a0; a3 -> end; b3 -> end; start [shape=Mdiamond]; end [shape=Msquare]; }
使用Graphviz执行此脚本,即可生成相应的图片:

相关资料
官方网站; http://www.graphviz.org/
使用 Graphviz 生成自动化系统图
PlantUML
PlantUML 是一个开源项目,并支持快速绘制:
- 时序图
- 用例图
- 类图
- 活动图
- 组件图
- 状态图
- Deployment diagram,
- 对象图
- wireframe graphical interface
以简单并带指引性语言定义各种视图。 ( ![]() ).
).
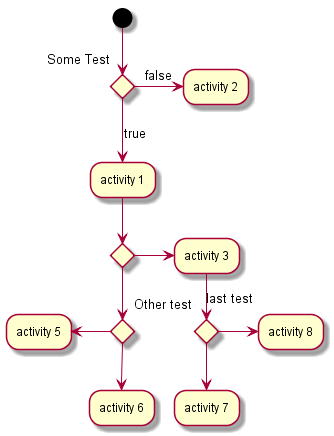
官方示例如下:
@startuml (*) --> if "Some Test" then -->[true] "activity 1" if "" then -> "activity 3" as a3 else if "Other test" then -left-> "activity 5" else --> "activity 6" endif endif else ->[false] "activity 2" endif a3 --> if "last test" then --> "activity 7" else -> "activity 8" endif @enduml
生成的图片:
相关资料
官方网站: http://zh.plantuml.com/
UMLGraph
UMLGraph与PlantUML功能类似,支持类图、时序图、流程图等,功能上两个工具各有千秋,各位可自行发掘。
下面是官方示例:
# UML Distilled: Figure 5-2 p. 70 .PS copy "sequence.pic"; boxwid = 1.3; # Define the objects pobject(X); pobject(T); pobject(C); pobject(A1); pobject(A2); # Message sequences cmessage(X,T,"a: Transaction"); active(T); async(); cmessage(T,C,"a: TransCoord"); inactive(T); active(C); cmessage(C,A1,"a1: TransCheck"); active(A1); cmessage(C,A2,"a2: TransCheck"); active(A2); message(A1,C,"ok"); sync(); step(); active(C); message(C,C,"all done?"); inactive(C); async(); step(); delete(A1); inactive(C); step(); message(A2,C,"ok"); active(C); sync(); step(); active(C); message(C,C,"all done?"); inactive(C); async(); step(); delete(A2); message(C,T,"beValid"); inactive(C); active(T); step(); complete(T); complete(C); .PE
生成的图片:

相关资料
官方网站: http://www.umlgraph.org/
Mscgen
Mscgen工具主要用于处理和生成时序图,它实际是基于Graphviz的,将自己的脚本翻译成Graphviz的Dot脚本,然后使用Graphviz处理脚本,生成图片。虽然直接用Graphviz也可以写出同样的时序图脚本,但是相对于Mscgen来说,Graphviz要复杂的多。
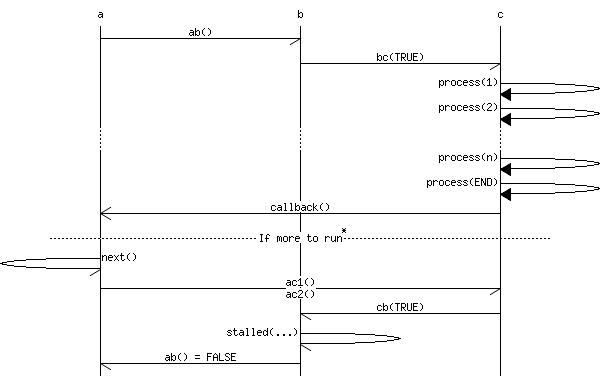
下面是官方的示例:
# MSC for some fictional process msc { hscale = "2"; a,b,c; a->b [ label = "ab()" ] ; b->c [ label = "bc(TRUE)"]; c=>c [ label = "process(1)" ]; c=>c [ label = "process(2)" ]; ...; c=>c [ label = "process(n)" ]; c=>c [ label = "process(END)" ]; a<<=c [ label = "callback()"]; --- [ label = "If more to run", ID="*" ]; a->a [ label = "next()"]; a->c [ label = "ac1()/nac2()"]; b<-c [ label = "cb(TRUE)"]; b->b [ label = "stalled(...)"]; a<-b [ label = "ab() = FALSE"]; }
生成后的图片:
Mscgen工具要有另外一个功能,可以将脚本嵌入到Doxygen的注释里面,用Doxygen生成后的文档里面就会包含相应的时序图。
注释如下:
/** Sender class. Can be used to send a command to the server. * The receiver will acknowledge the command by calling Ack(). * /msc * Sender,Receiver; * Sender->Receiver [label="Command()", URL="/ref Receiver::Command()"]; * Sender<-Receiver [label="Ack()", URL="/ref Ack()", ID="1"]; * /endmsc */ class Sender { public: /** Acknowledgment from server */ void Ack(bool ok); }; /** Receiver class. Can be used to receive and execute commands. * After execution of a command, the receiver will send an acknowledgment * /msc * Receiver,Sender; * Receiver<-Sender [label="Command()", URL="/ref Command()"]; * Receiver->Sender [label="Ack()", URL="/ref Sender::Ack()", ID="1"]; * /endmsc */ class Receiver { public: /** Executable a command on the server */ void Command(int commandId); };
相关资料
官方网站: http://www.mcternan.me.uk/mscgen/
Doxygen——msc
Msc-generator
Msc-generator是与Mscgen比较类似的工具,主要用于绘制时序图。Msc-generator从4.0版本开始,也支持Doxygen的调用了。
官方示例:
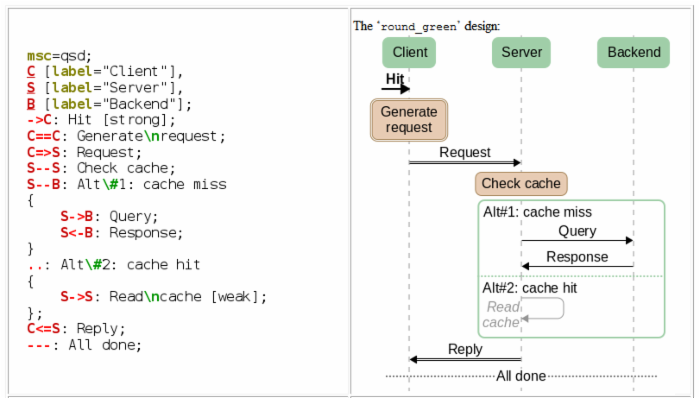
相关资料
官方网站: https://sites.google.com/site/mscgen2393/home
下载: http://sourceforge.net/projects/msc-generator/
Changing Message Sequence Chart (MSC) Tool for Doxygen
yUML
yUML是一款Web上的UML工具,同样,也是输入一些脚本,然后自动生成相应图形。
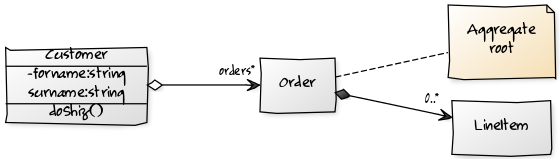
官方示例:
// Cool Class Diagram [Customer|-forname:string;surname:string|doShiz()]<>-orders*>[Order] [Order]++-0..*>[LineItem] [Order]-[note:Aggregate root{bg:wheat}]
生成的图片:
yUML还支持外链的方式,下面是外链方式的示例:
<img src="http://www.liuhaihua.cn/wp-content/uploads/2015/10/note-You-can-stick-notes-on-diagrams-toobgcornsilkCustomerltgt1-orders-0..gtOrder-Order-gtLineItem-Order-1gtDeliveryMethod-Order-gtProduct-Categorylt-gtProduct-DeliveryMethod^National-DeliveryMethod^International.png" >

相关资料
官方网站: http://yuml.me/
官方示例: http://yuml.me/diagram/scruffy/class/samples
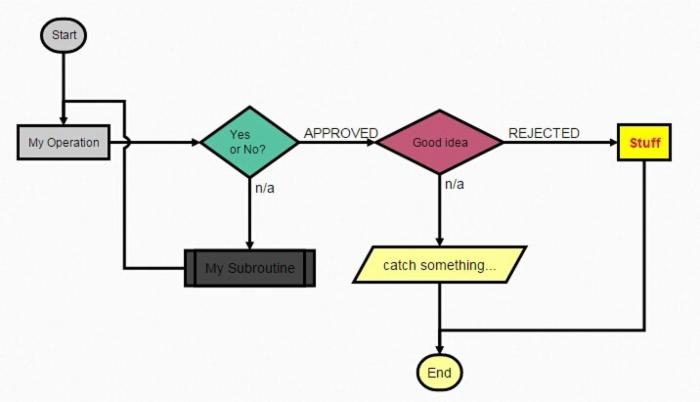
flowchart.js
Web发展的这么迅速,js的图形、图表库数不胜数,那么也一定会有脚本转换图形的库。flowchart.js就是其中一个还不错的js库,它直接生成SVG图形。
官方示例:
st=>start: Start|past:>http://www.google.com[blank] e=>end: End|future:>http://www.google.com op1=>operation: My Operation|past op2=>operation: Stuff|current sub1=>subroutine: My Subroutine|invalid cond=>condition: Yes or No?|approved:>http://www.google.com c2=>condition: Good idea|rejected io=>inputoutput: catch something...|future st->op1(right)->cond cond(yes, right)->c2 cond(no)->sub1(left)->op1 c2(yes)->io->e c2(no)->op2->e
生成的SVG截图:
相关资料
官方网站: http://adrai.github.io/flowchart.js/
源码: https://github.com/adrai/flowchart.js
其他工具
类似的工具还有很多,就不详细的一一展示了,只做一下简单介绍:
- Sequence Chart Studio :本地工具,主要用于绘制时序图
- Quick Sequence Diagram Editor :本地工具,主要用于绘制时序图
- ckwnc :Web工具,主要用于绘制时序图
- JUMLY :JS库,主要用于绘制时序图,输出格式为SVG
- js-sequence-diagrams :JS库,主要用于绘制时序图,输出格式为SVG
- mermaid :JS库,可用于绘制时序图、流程图、甘特图等,功能比较强大,输出格式为SVG
- PlantUML网站总结的相关工具
总结
现在真是一个百花齐放,百家争鸣的时代,各种工具层出不穷,用脚本生成时序图、流程图的工具都有这么多。
虽然文中列举了这么的工具,但是我也只用过其中的一两个,大部分只是看了官网的介绍以及实例,并没有实际操作,如果有不对的地方,还望指正。
各位,放下鼠标,让你们的双手在键盘上舞动起来吧!
正文到此结束
热门推荐


相关文章


Loading...
![[HBLOG]公众号](http://www.liuhaihua.cn/img/qrcode_gzh.jpg)

