三封报警邮件的分析
今天收到3封报警邮件,从邮件内容中的报警情况来看,还是比较反常的。需要引起关注,找到原因处理。
这个库是一个历史库,库中的数据非常庞大,几十亿数据的表还是有好几个。但是访问频率很低,一般到历史库中所做的历史数据分析查询需求还是要少很多。
报警邮件如下,可以看到DB time的阀值还是很高的。
#邮件1
[DB监控系统]_testdb2_hist_p@10.12.6.18_报警
ZABBIX-监控系统:
------------------------------------
报警内容: DB time is too high
------------------------------------
报警级别: PROBLEM
------------------------------------
监控项目: DBtime:1403 %
------------------------------------
报警时间:2015.10.21-05:09:35
##邮件2
ZABBIX-监控系统:
------------------------------------
报警内容: DB time is too high
------------------------------------
报警级别: PROBLEM
------------------------------------
监控项目: DBtime:1403 %
------------------------------------
报警时间:2015.10.21-05:19:35
#邮件3
ZABBIX-监控系统:
-------------------------------
监控项目: DBtime_447 %
------------------------------------
主机名称:testdb2_hist_p@10.12.6.18
------------------------------------
恢复时间:2015.10.21-05:29:38
通过这三封邮件可以看到,问题持续了有近20分钟,然后恢复正常。
那么这种抖动通过快照级的数据情况来看,还是可以体现出明显的浮动。
Current Instance
~~~~~~~~~~~~~~~~
DBID DB_NAME INST_NUM INST_NAME
---------- --------- ---------- ----------------
2534640677 testdb2 1 testdb2
DB_NAME BEGIN_SNAP END_SNAP SNAPDATE LVL DURATION_MINS DBTIME
--------- ---------- ---------- -------------------- ---------- ------------- ----------
testdb2 45336 45337 21 Oct 2015 00:00 1 30 0
45337 45338 21 Oct 2015 00:30 1 30 0
45338 45339 21 Oct 2015 01:00 1 30 0
45339 45340 21 Oct 2015 01:30 1 30 4
45340 45341 21 Oct 2015 02:00 1 30 40
45341 45342 21 Oct 2015 02:31 1 30 30
45342 45343 21 Oct 2015 03:00 1 29 31
45343 45344 21 Oct 2015 03:30 1 30 31
45344 45345 21 Oct 2015 04:00 1 30 31
45345 45346 21 Oct 2015 04:30 1 30 31
45346 45347 21 Oct 2015 05:00 1 30 131
45347 45348 21 Oct 2015 05:30 1 30 0
45348 45349 21 Oct 2015 06:00 1 30 3
这个时候自己就对自己提出一个问题,为什么平时不会报出这个问题?
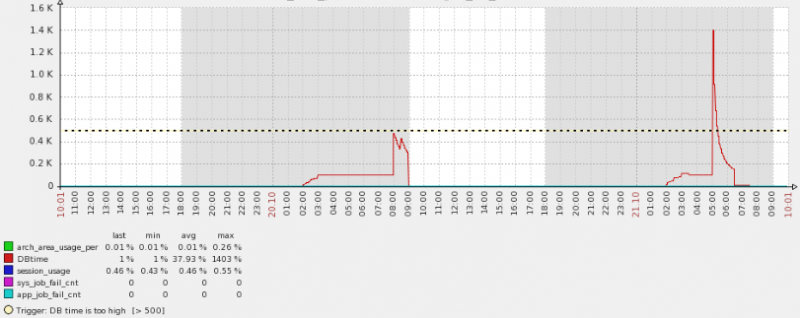
下面的图是两天内的DB time情况,通过下面的图可以看到DB time前一天是到了临界阀值,但是还没有越界,所以没有报警,而昨天却又很大的抖动。
通过下面的图可以看到,在凌晨的时候,不只报警的时间点存在大量的等待时间,主要等待时间为multiblock read,而且持续时间还是几个小时。
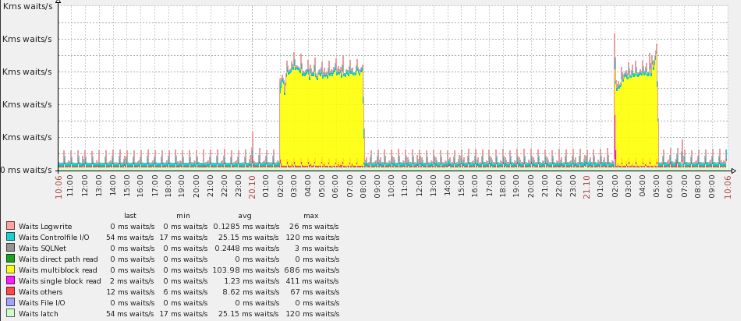
可见还是存在着大量的读操作,相对来说还是比较高的。
鉴于此,基本可以推断可以是sql级的原因导致的,先抓取一个报告,看看在问题时间段里,哪些sql占用了大量的DB time
ksh showsnapsql.sh 45347
SNAP_ID SQL_ID EXECUTIONS_DELTA ELAPSED_TI PER_TOTAL
---------- ------------- ---------------- ---------- ----------
45347 b6usrg82hwsa3 1 391s 47%
45347 3rz14z1006jbk 18 290s 35%
45347 53yakkh4cbmp9 3 98s 12%
45347 4yf9vjwa2yg5j 6 9s 1%
45347 04m0jsy80udjp 6 0s 0%
从这个图可以看出,问题还是比较明显的,sql_id为b6usrg82hwsa3的语句占用了大量的DB time.
那么来看看是怎么样的一条sql语句,抓取下来看到竟然是一个后台job.
SQL_FULLTEXT
----------------------------------------------------------------------------------------------------
call dbms_stats.gather_database_stats_job_proc ( )
对于这个问题,同样有一些疑点,首先为什么今天的负载就格外高,平时也在运行这些自动任务。还有为什么job会持续很长的时间,每天都在消耗大量的资源。
查看数据库日志内容如下:
Wed Oct 21 02:00:15 2015
DBMS_STATS: GATHER_STATS_JOB encountered errors. Check the trace file.
Errors in file /U02/app/oracle/diag/rdbms/testdb2/testdb2/trace/testdb2_j000_3799.trc:
ORA-20011: Approximate NDV failed: ORA-29913: error in executing ODCIEXTTABLEOPEN callout
KUP-11024: This external table can only be accessed from within a Data Pump job.
Wed Oct 21 02:01:44 2015
End automatic SQL Tuning Advisor run for special tuning task "SYS_AUTO_SQL_TUNING_TASK"
Wed Oct 21 06:01:28 2015
DBMS_STATS: GATHER_STATS_JOB encountered errors. Check the trace file.
Errors in file /U02/app/oracle/diag/rdbms/testdb2/testdb2/trace/testdb2_j000_16901.trc:
ORA-20011: Approximate NDV failed: ORA-29913: error in executing ODCIEXTTABLEOPEN callout
KUP-11024: This external table can only be accessed from within a Data Pump job.
Wed Oct 21 06:20:33 2015
Thread 1 advanced to log sequence 99940 (LGWR switch)
Current log# 22 seq# 99940 mem# 0: +DATA/testdb2/onlinelog/group_22.863.811354265
Wed Oct 21 06:20:38 2015
Archived Log entry 215736 added for thread 1 sequence 99939 ID 0x9bd5d836 dest 1:
Wed Oct 21 08:00:00 2015
Closing scheduler window
Closing Resource Manager plan via scheduler window
Clearing Resource Manager plan via parameter
create tablespace DETAIL_DATA_20160110 datafile '+data' size 50m autoextend on next 10m maxsize 34359721984
Completed: create tablespace TLDETAIL_DATA_20160110 datafile '+data' size 50m autoextend on next 10m maxsize 34359721984
create tablespace DETAIL_INDEX_20160110 datafile '+data' size 50m autoextend on next 10m maxsize 34359721984
Completed: create tablespace TLDETAIL_INDEX_20160110 datafile '+data' size 50m autoextend on next 10m maxsize 34359721984
create tablespace SERLOG_DATA_20160110 datafile '+data' size 50m autoextend on next 10m maxsize 34359721984
Completed: create tablespace TLSERLOG_DATA_20160110 datafile '+data' size 50m autoextend on next 10m maxsize 34359721984
通过这个日志可以看出还是存在两个问题,一个是因为尝试去收集统计信息的job失败了。还有一个是表在昨天创建了大量的表空间。
问题可以初步分解。报错的trace文件内容如下,发现是一个datapump的临时表导致的。
$ less /U02/app/oracle/diag/rdbms/testdb2/testdb2/trace/testdb2_j000_3799.trc
*** 2015-10-21 02:00:15.184
*** SESSION ID:(5090.5085) 2015-10-21 02:00:15.184
*** CLIENT ID:() 2015-10-21 02:00:15.184
*** SERVICE NAME:(SYS$USERS) 2015-10-21 02:00:15.184
*** MODULE NAME:(DBMS_SCHEDULER) 2015-10-21 02:00:15.184
*** ACTION NAME:(ORA$AT_OS_OPT_SY_5869) 2015-10-21 02:00:15.184
ORA-20011: Approximate NDV failed: ORA-29913: error in executing ODCIEXTTABLEOPEN callout
KUP-11024: This external table can only be accessed from within a Data Pump job.
*** 2015-10-21 02:00:15.184
DBMS_STATS: GATHER_STATS_JOB: GATHER_TABLE_STATS('"SYS"','"ET$136C02550001"','""', ...)
DBMS_STATS: ORA-20011: Approximate NDV failed: ORA-29913: error in executing ODCIEXTTABLEOPEN callout
KUP-11024: This external table can only be accessed from within a Data Pump job.
至于这个临时表为什么没有清除,还是历史原因,早已经存在很久了。所以还是可以验证后直接drop.
当然为了彻底解决问题还是抓取问题的本质,所以先删除这个有问题的临时表。
SQL> select owner,table_name from dba_tables where table_name like 'ET%';
OWNER TABLE_NAME
------------------------------ ------------------------------
SYS ET$136C02550001
SQL> DROP TABLE ET$136C02550001;
Table dropped.
这个时候还是先保留后台job enable,然后对比一下在同样的情况下,今天的负载情况。但是单纯来分析alert日志,发现每天的几个时段都都会存在ORA的问题。
$ grep -B5 "ORA-20011" alert*.log|grep 2015
Thu Oct 15 02:00:13 2015
Thu Oct 15 06:03:14 2015
Fri Oct 16 02:00:13 2015
Fri Oct 16 02:00:24 2015
Fri Oct 16 06:04:35 2015
Sat Oct 17 06:00:12 2015
Sat Oct 17 10:06:10 2015
Sat Oct 17 14:06:27 2015
Sat Oct 17 18:06:37 2015
Sat Oct 17 22:06:51 2015
Sun Oct 18 06:00:01 2015
Sun Oct 18 06:00:12 2015
Sun Oct 18 06:16:25 2015
Sun Oct 18 10:07:31 2015
Sun Oct 18 14:07:45 2015
Sun Oct 18 18:08:02 2015
Sun Oct 18 22:08:13 2015
Mon Oct 19 02:00:10 2015
Mon Oct 19 06:08:44 2015
Tue Oct 20 02:00:16 2015
Wed Oct 21 02:00:02 2015
Wed Oct 21 02:00:15 2015
Wed Oct 21 02:01:44 2015
Wed Oct 21 06:01:28 2015
所以这个问题看来还是影响很大,也算遗留历史问题。
至于为什么负载突然升高那么多,一般来说后台的自动任务的消耗还是相对较高,但是也高不了多少。为什么统计信息,统计信息收集的阀值,可以参考mos的文章。
Automatic Optimizer Statistics Collection on Partitioned Table (Doc ID 1592404.1)
这个库是一个历史库,库中的数据非常庞大,几十亿数据的表还是有好几个。但是访问频率很低,一般到历史库中所做的历史数据分析查询需求还是要少很多。
报警邮件如下,可以看到DB time的阀值还是很高的。
#邮件1
[DB监控系统]_testdb2_hist_p@10.12.6.18_报警
ZABBIX-监控系统:
------------------------------------
报警内容: DB time is too high
------------------------------------
报警级别: PROBLEM
------------------------------------
监控项目: DBtime:1403 %
------------------------------------
报警时间:2015.10.21-05:09:35
##邮件2
ZABBIX-监控系统:
------------------------------------
报警内容: DB time is too high
------------------------------------
报警级别: PROBLEM
------------------------------------
监控项目: DBtime:1403 %
------------------------------------
报警时间:2015.10.21-05:19:35
#邮件3
ZABBIX-监控系统:
-------------------------------
监控项目: DBtime_447 %
------------------------------------
主机名称:testdb2_hist_p@10.12.6.18
------------------------------------
恢复时间:2015.10.21-05:29:38
通过这三封邮件可以看到,问题持续了有近20分钟,然后恢复正常。
那么这种抖动通过快照级的数据情况来看,还是可以体现出明显的浮动。
Current Instance
~~~~~~~~~~~~~~~~
DBID DB_NAME INST_NUM INST_NAME
---------- --------- ---------- ----------------
2534640677 testdb2 1 testdb2
DB_NAME BEGIN_SNAP END_SNAP SNAPDATE LVL DURATION_MINS DBTIME
--------- ---------- ---------- -------------------- ---------- ------------- ----------
testdb2 45336 45337 21 Oct 2015 00:00 1 30 0
45337 45338 21 Oct 2015 00:30 1 30 0
45338 45339 21 Oct 2015 01:00 1 30 0
45339 45340 21 Oct 2015 01:30 1 30 4
45340 45341 21 Oct 2015 02:00 1 30 40
45341 45342 21 Oct 2015 02:31 1 30 30
45342 45343 21 Oct 2015 03:00 1 29 31
45343 45344 21 Oct 2015 03:30 1 30 31
45344 45345 21 Oct 2015 04:00 1 30 31
45345 45346 21 Oct 2015 04:30 1 30 31
45346 45347 21 Oct 2015 05:00 1 30 131
45347 45348 21 Oct 2015 05:30 1 30 0
45348 45349 21 Oct 2015 06:00 1 30 3
这个时候自己就对自己提出一个问题,为什么平时不会报出这个问题?
下面的图是两天内的DB time情况,通过下面的图可以看到DB time前一天是到了临界阀值,但是还没有越界,所以没有报警,而昨天却又很大的抖动。
通过下面的图可以看到,在凌晨的时候,不只报警的时间点存在大量的等待时间,主要等待时间为multiblock read,而且持续时间还是几个小时。
可见还是存在着大量的读操作,相对来说还是比较高的。
鉴于此,基本可以推断可以是sql级的原因导致的,先抓取一个报告,看看在问题时间段里,哪些sql占用了大量的DB time
ksh showsnapsql.sh 45347
SNAP_ID SQL_ID EXECUTIONS_DELTA ELAPSED_TI PER_TOTAL
---------- ------------- ---------------- ---------- ----------
45347 b6usrg82hwsa3 1 391s 47%
45347 3rz14z1006jbk 18 290s 35%
45347 53yakkh4cbmp9 3 98s 12%
45347 4yf9vjwa2yg5j 6 9s 1%
45347 04m0jsy80udjp 6 0s 0%
从这个图可以看出,问题还是比较明显的,sql_id为b6usrg82hwsa3的语句占用了大量的DB time.
那么来看看是怎么样的一条sql语句,抓取下来看到竟然是一个后台job.
SQL_FULLTEXT
----------------------------------------------------------------------------------------------------
call dbms_stats.gather_database_stats_job_proc ( )
对于这个问题,同样有一些疑点,首先为什么今天的负载就格外高,平时也在运行这些自动任务。还有为什么job会持续很长的时间,每天都在消耗大量的资源。
查看数据库日志内容如下:
Wed Oct 21 02:00:15 2015
DBMS_STATS: GATHER_STATS_JOB encountered errors. Check the trace file.
Errors in file /U02/app/oracle/diag/rdbms/testdb2/testdb2/trace/testdb2_j000_3799.trc:
ORA-20011: Approximate NDV failed: ORA-29913: error in executing ODCIEXTTABLEOPEN callout
KUP-11024: This external table can only be accessed from within a Data Pump job.
Wed Oct 21 02:01:44 2015
End automatic SQL Tuning Advisor run for special tuning task "SYS_AUTO_SQL_TUNING_TASK"
Wed Oct 21 06:01:28 2015
DBMS_STATS: GATHER_STATS_JOB encountered errors. Check the trace file.
Errors in file /U02/app/oracle/diag/rdbms/testdb2/testdb2/trace/testdb2_j000_16901.trc:
ORA-20011: Approximate NDV failed: ORA-29913: error in executing ODCIEXTTABLEOPEN callout
KUP-11024: This external table can only be accessed from within a Data Pump job.
Wed Oct 21 06:20:33 2015
Thread 1 advanced to log sequence 99940 (LGWR switch)
Current log# 22 seq# 99940 mem# 0: +DATA/testdb2/onlinelog/group_22.863.811354265
Wed Oct 21 06:20:38 2015
Archived Log entry 215736 added for thread 1 sequence 99939 ID 0x9bd5d836 dest 1:
Wed Oct 21 08:00:00 2015
Closing scheduler window
Closing Resource Manager plan via scheduler window
Clearing Resource Manager plan via parameter
create tablespace DETAIL_DATA_20160110 datafile '+data' size 50m autoextend on next 10m maxsize 34359721984
Completed: create tablespace TLDETAIL_DATA_20160110 datafile '+data' size 50m autoextend on next 10m maxsize 34359721984
create tablespace DETAIL_INDEX_20160110 datafile '+data' size 50m autoextend on next 10m maxsize 34359721984
Completed: create tablespace TLDETAIL_INDEX_20160110 datafile '+data' size 50m autoextend on next 10m maxsize 34359721984
create tablespace SERLOG_DATA_20160110 datafile '+data' size 50m autoextend on next 10m maxsize 34359721984
Completed: create tablespace TLSERLOG_DATA_20160110 datafile '+data' size 50m autoextend on next 10m maxsize 34359721984
通过这个日志可以看出还是存在两个问题,一个是因为尝试去收集统计信息的job失败了。还有一个是表在昨天创建了大量的表空间。
问题可以初步分解。报错的trace文件内容如下,发现是一个datapump的临时表导致的。
$ less /U02/app/oracle/diag/rdbms/testdb2/testdb2/trace/testdb2_j000_3799.trc
*** 2015-10-21 02:00:15.184
*** SESSION ID:(5090.5085) 2015-10-21 02:00:15.184
*** CLIENT ID:() 2015-10-21 02:00:15.184
*** SERVICE NAME:(SYS$USERS) 2015-10-21 02:00:15.184
*** MODULE NAME:(DBMS_SCHEDULER) 2015-10-21 02:00:15.184
*** ACTION NAME:(ORA$AT_OS_OPT_SY_5869) 2015-10-21 02:00:15.184
ORA-20011: Approximate NDV failed: ORA-29913: error in executing ODCIEXTTABLEOPEN callout
KUP-11024: This external table can only be accessed from within a Data Pump job.
*** 2015-10-21 02:00:15.184
DBMS_STATS: GATHER_STATS_JOB: GATHER_TABLE_STATS('"SYS"','"ET$136C02550001"','""', ...)
DBMS_STATS: ORA-20011: Approximate NDV failed: ORA-29913: error in executing ODCIEXTTABLEOPEN callout
KUP-11024: This external table can only be accessed from within a Data Pump job.
至于这个临时表为什么没有清除,还是历史原因,早已经存在很久了。所以还是可以验证后直接drop.
当然为了彻底解决问题还是抓取问题的本质,所以先删除这个有问题的临时表。
SQL> select owner,table_name from dba_tables where table_name like 'ET%';
OWNER TABLE_NAME
------------------------------ ------------------------------
SYS ET$136C02550001
SQL> DROP TABLE ET$136C02550001;
Table dropped.
这个时候还是先保留后台job enable,然后对比一下在同样的情况下,今天的负载情况。但是单纯来分析alert日志,发现每天的几个时段都都会存在ORA的问题。
$ grep -B5 "ORA-20011" alert*.log|grep 2015
Thu Oct 15 02:00:13 2015
Thu Oct 15 06:03:14 2015
Fri Oct 16 02:00:13 2015
Fri Oct 16 02:00:24 2015
Fri Oct 16 06:04:35 2015
Sat Oct 17 06:00:12 2015
Sat Oct 17 10:06:10 2015
Sat Oct 17 14:06:27 2015
Sat Oct 17 18:06:37 2015
Sat Oct 17 22:06:51 2015
Sun Oct 18 06:00:01 2015
Sun Oct 18 06:00:12 2015
Sun Oct 18 06:16:25 2015
Sun Oct 18 10:07:31 2015
Sun Oct 18 14:07:45 2015
Sun Oct 18 18:08:02 2015
Sun Oct 18 22:08:13 2015
Mon Oct 19 02:00:10 2015
Mon Oct 19 06:08:44 2015
Tue Oct 20 02:00:16 2015
Wed Oct 21 02:00:02 2015
Wed Oct 21 02:00:15 2015
Wed Oct 21 02:01:44 2015
Wed Oct 21 06:01:28 2015
所以这个问题看来还是影响很大,也算遗留历史问题。
至于为什么负载突然升高那么多,一般来说后台的自动任务的消耗还是相对较高,但是也高不了多少。为什么统计信息,统计信息收集的阀值,可以参考mos的文章。
Automatic Optimizer Statistics Collection on Partitioned Table (Doc ID 1592404.1)
正文到此结束
热门推荐


相关文章

近期评论
-
你这基本没有更新呀,最近文章显示还是2019年的文章。不符合要求哈
-
关键词:慕云博客 链接:https://www.lilun.me 描述:分享原创文字的个人博客
-
-
-
可以提供一下源码吗
-
不是商业站,鸡娃学习笔记
-
-
-
-
听他们说很厉害的样子
Loading...
![[HBLOG]公众号](http://www.liuhaihua.cn/img/qrcode_gzh.jpg)

