看看这些年你都学了什么?
数据可视化
多年下来,我的 Google Bookmarks 里已经有近万条的书签。大部分内容是我在读过一遍之后就收藏起来的,也有很多看了一眼之后,觉得不错,然后收藏起来准备以后读的(当然,你也知道,再也没有打开过)。
有没有一个方法可以让我以可视化的方式,看到这些年我都学了那些东西呢?将书签列表作为源数据,然后将这些信息可视化出来会非常有意思:比如收藏夹中的热门词是什么,哪段时间收藏了多少条的书签(学习投入程度趋势)等等。
下图是我的书签中,排行前 30 的关键字排序。可以明显的看出,我对于 JavaScript 的喜爱程度相当高,对 美食 的喜爱也超过了 python 和 linux 。

这里我将使用 python ,结合 python 的一些库来实现 书签可视化 。简而言之,整个过程可以分成这样几个步骤:
- 将Google Bookmarks导出为本地文件
- 将书签文件解析为容易处理的内部格式(比如python的dict等)
- 由于书签中会有中文的句子,所以会涉及到分词
- 统计词语的频率,并绘制成图标
数据源
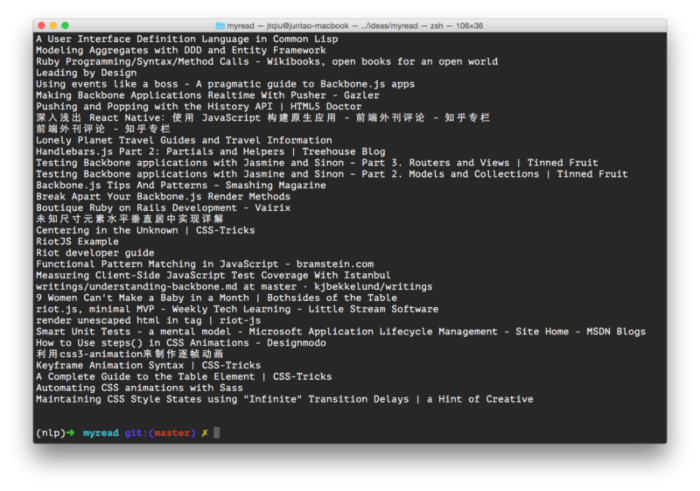
Google Bookmarks 本身可以直接导出成 HTML 文件。该 HTML 文件包含了时间戳和书签的标题,我们可以通过 python 的库 BeautifulSoup 将HTML中的文本抽取出来:
from bs4 import BeautifulSoup def load_bookmarks_data(): soup = BeautifulSoup(open('bookmarks_10_21_15.html').read(), "html.parser") return soup.get_text() if __name__ == "__main__": print load_bookmarks_data() BeautifulSoup 提供非常好用的API来抽取结构化文档中的内容。
分词
BeautifulSoup 获得的是一条条独立的句子,我们需要使用分词器将所有的句子分解成片段。这里我使用了 jieba ( 结巴分词 )分词器来完成这个任务:
import jieba data = "我在出报表,你的博客写的怎么样了" seg_list = jieba.cut(data, cut_all=False) for seg in seg_list: print seg 将会输出:
我 在 出 报表 , 你 的 博客 写 的 怎么样 了 我们定义一个方法来将上一步中的文本分词:
def extract_segments(data): seg_list = jieba.cut(data, cut_all=False) return [seg.strip().lower() for seg in seg_list if len(seg) > 1] 分词之后,我们将单词转换为小写,并剔除掉那些长度小于1的字符串。这样可以保证所有的词都是词语。python的 list推导式 写起来非常简洁,一行代码就完成了 过滤 和 映射 的工作。
可视化
有了分好的词之后,只需要统计每个词出现的频率,然后按照频率来绘制图表。我们使用 python 标准库中的 Counter 来实现:
from collections import Counter def tokenize(): filtered = extract_segments(load_bookmarks_data()) return Counter([word for word in filtered]) 要获取前 N 个,只需要使用 most_common(N) 即可:
tokenize().most_common(10) [(u'and', 552), (u'the', 501), (u'with', 485), (u'to', 446), (u'javascript', 432), (u'in', 330), (u'for', 308), (u'...', 270), (u'java', 270), (u'blog', 269)] 有了数据之后,使用 matplotlib 做一个简单的 bar 图标:
import matplotlib import matplotlib.pyplot as plt from pandas import DataFrame def visualize(): frame = DataFrame(tokenize().most_common(20), columns=['keywords', 'frequencies']) ax = frame.plot(kind='bar') plt.savefig('bookmarks_trending.png', format='png', dpi=600) 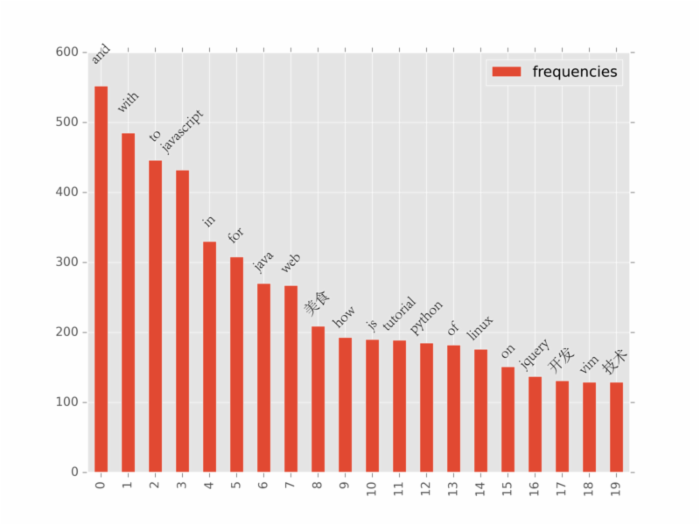
stopwords
不过,上图中有很多噪音信息,如 and , the 等,这些在所有文章中都会出现的词并没有实际意义,统称为 stopwords 。通常在计算过程中会将其忽略:
def tokenize(): stoplist = ['i', 'me', 'my', 'myself', 'we', 'our', 'ours', 'ourselves', 'you', 'your', 'yours', 'yourself', 'yourselves', 'he', 'him', 'his', 'himself', 'she', 'her', 'hers', 'herself', 'it', 'its', 'itself', 'they', 'them', 'their', 'theirs', 'themselves', 'what', 'which', 'who', 'whom', 'this', 'that', 'these', 'those', 'am', 'is', 'are', 'was', 'were', 'be', 'been', 'being', 'have', 'has', 'had', 'having', 'do', 'does', 'did', 'doing', 'a', 'an', 'the', 'and', 'but', 'if', 'or', 'because', 'as', 'until', 'while', 'of', 'at', 'by', 'for', 'with', 'about', 'against', 'between', 'into', 'through', 'during', 'before', 'after', 'above', 'below', 'to', 'from', 'up', 'down', 'in', 'out', 'on', 'off', 'over', 'under', 'again', 'further', 'then', 'once', 'here', 'there', 'when', 'where', 'why', 'how', 'all', 'any', 'both', 'each', 'few', 'more', 'most', 'other', 'some', 'such', 'no', 'nor', 'not', 'only', 'own', 'same', 'so', 'than', 'too', 'very', 's', 't', 'can', 'will', 'just', 'don', 'should', 'now'] stoplist.extend(['...', 'com', 'using', u'使用', 'blog', u'博客', u'博客园', u'做法', u'论坛', 'part', u'部分', u'天下']) filtered = extract_segments(load_bookmarks_data()) return Counter([word for word in filtered if word not in stoplist]) 重新绘制即可获得上文中的图:
完整的代码 请参考这里 。
正文到此结束
热门推荐


相关文章

近期评论
-
你这基本没有更新呀,最近文章显示还是2019年的文章。不符合要求哈
-
关键词:慕云博客 链接:https://www.lilun.me 描述:分享原创文字的个人博客
-
-
-
可以提供一下源码吗
-
不是商业站,鸡娃学习笔记
-
-
-
-
听他们说很厉害的样子
Loading...
![[HBLOG]公众号](http://www.liuhaihua.cn/img/qrcode_gzh.jpg)

