数据可视化的10个关键术语
[ 数据技能 ] 数据可视化的10个关键术语
2015-10-30 12:05 | 发布者:猫儿 来自: Via:PPV课大数据 | 关键词:
沙龙旗下【萝卜网】推出互联网人必学的的精品课,注册即送7天VIP! 点此查看详情!
ormat 交互方式

Interactive visualisations allow you to modify, manipulate and explore a computer-based display of data. The vast majority of interactive visualisations are found on websites but increasingly might also exist within apps on tablets and smartphones. By contrast, a static visualisation displays a single, non-interactive display of data, often with the aim for it to be viewed in print as well as on a screen.
交互式可视化允许您修改,操作和探索计算机显示的数据。绝大多数交互式可视化系统在计算机网络上,但越来越多出现在平板电脑和智能手机上。相比之下,静态可视化只显示单一的、非交互数据,它通常是为了打印和在屏幕上显示。

Charts are individual visual representations of data. There are many ways of representing your data, using different marks, shapes and layouts: these are all called types of charts. Some chart types you might be familiar with, such as the bar chart, pie chart or line chart, whilst others may be new to you, like the sankey diagram, tree map, choropleth map. See the section called ‘Taking time with visualisation’ for more on chart types.
图表是数据视觉化表示的特殊方式。表示数据的方法有很多,如使用不同的符号、形状和排列,我们把这些称之为图表的类型。一些图表类型你比较熟悉,如条形图、饼图、折线图,但其他类型你可能就很少见了,如桑基图、树图、等值线图的地图。
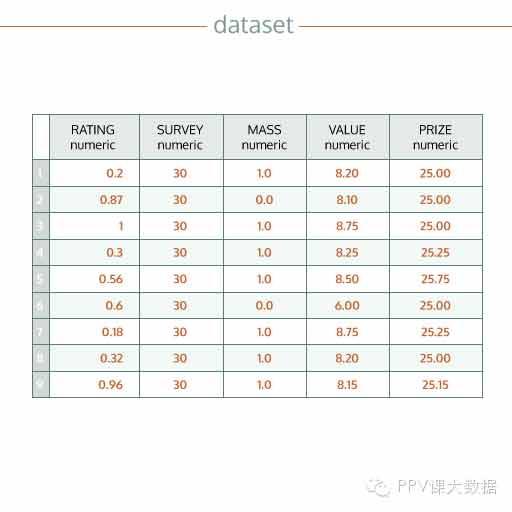
A dataset is a collection of data upon which a visualisation is based. It is useful to think of a dataset as taking the form of a table with rows and columns, usually existing in a spreadsheet or database. The rows are the records – instances of things – and the columns are the variables – details about the things. Datasets are visualised in order to ‘see’ the size, patterns and relationships that are otherwise hard to observe.
数据集合是需要可视化处理的数据集合。你可以简单认为数据集合就是很多行和列的数据,这些数据通常在电子表格或数据库中。行代表一个记录,也就是一个事务的实例;列是变量,代表事务的具体信息。数据集合的大小、形式和关系是可以看到的,否则我们就很难观察。

When visualisers want to show you where the data or information comes from, they will include it in the visualisation. Sometimes it appears near the title or the bottom of the page. Other times, if the visualisation comes with an article, you can find it in the accompanying text.
当数据可视图的作者想告诉你展示的数据或信息的来源时,这些来源信息也会显示出来。通常会显示在标题附近或页面的底部。如果数据可视图有文章资料,你可以在文章中找到来源信息。
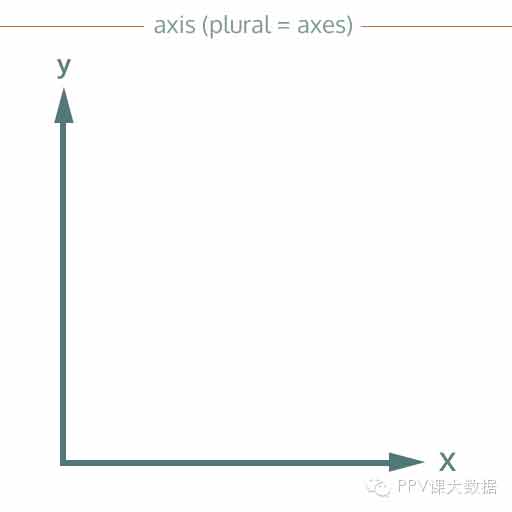
Many types of chart have axes. These are the lines that go up and down (the vertical Y axis), or left and right (the horizontal X axis), providing a reference for reading the height or position of data values. Axes are the place where you will usually see the scale (see below) providing a stable reference point against which you form your reading of the chart.
正文到此结束
热门推荐


相关文章


Loading...
![[HBLOG]公众号](http://www.liuhaihua.cn/img/qrcode_gzh.jpg)

