FBMemoryProfiler 基础教程
FBMemoryProfiler 是Facebook开源的一款用于分析iOS内存使用和检测循环引用的工具库。
在上一篇 [译文]在iOS上自动检测内存泄露 中,Facebook讲解了 FBMemoryProfiler 的核心原理。鉴于有人在评论里问怎么使用,我这里就简单介绍一下。
安装
CocoaPods
建议使用Cocoapods安装,只需要在pod文件中,添加这么一句就行:
pod 'FBMemoryProfiler' FBMemoryProfiler 最低支持iOS8,所以如果你的pod文件上最低要求是6或者7的话,是无法直接安装的。所以,建议在开发分支或者如果你有多个target的话,在开发的target上添加 FBMemoryProfiler ,在生产的target上不需要添加 FBMemoryProfiler 。
我一般习惯于有两个target,一个用于开发,里面可能会包含 Reveal 、蒲公英等的库,而这在生产包中是不必要的,另一个用于生产,只用于打生产包。
所以我的pod文件可能是这样的:
# Uncomment this line to define a global platform for your project platform :ios, '8.0' # Uncomment this line if you're using Swift # use_frameworks! target 'FBMemoryProfilerTest' do end target 'FBMemoryProfilerTest_Dev' do pod 'FBMemoryProfiler' end 
安装成功之后,打开对于的 .xcworkspace 文件即可。
Carthage
如果你的app从iOS8开始支持的话,你可以使用 Carthage 来安装。
在创建的 Cartfile 文件中添加:
github "facebook/FBMemoryProfiler" 之后,运行 carthage update --configuration Debug 即可。
因为我的app要从iOS6开始支持,所以我没有使用这个。
嵌入代码
首先,要在 main.m 中添加 FBRetainCycleDetector 的hook,同时,也要开启 FBAllocationTracker 的生成追踪:
#import <UIKit/UIKit.h> #import "AppDelegate.h" #if DEBUG #import <FBAllocationTracker/FBAllocationTrackerManager.h> #import <FBRetainCycleDetector/FBRetainCycleDetector.h> #endif int main(int argc, char * argv[]) { @autoreleasepool { #if DEBUG [FBAssociationManager hook]; [[FBAllocationTrackerManager sharedManager] startTrackingAllocations]; [[FBAllocationTrackerManager sharedManager] enableGenerations]; #endif return UIApplicationMain(argc, argv, nil, NSStringFromClass([AppDelegate class])); } } 我习惯于添加一个DEBUG标识符,只在Debug状态才开启 FBMemoryProfiler 。当然,你可以不需要。
之后,我们要在 AppDelegate.m 的 application: didFinishLaunchingWithOptions: 中嵌入 FBMemoryProfiler 的创建代码:
#if DEBUG #import <FBMemoryProfiler/FBMemoryProfiler.h> #import <FBRetainCycleDetector/FBRetainCycleDetector.h> #import "CacheCleanerPlugin.h" #import "RetainCycleLoggerPlugin.h" #endif @interface AppDelegate () { #if DEBUG FBMemoryProfiler *memoryProfiler; #endif } @end @implementation AppDelegate - (BOOL)application:(UIApplication *)application didFinishLaunchingWithOptions:(NSDictionary *)launchOptions { #if DEBUG memoryProfiler = [[FBMemoryProfiler alloc] initWithPlugins:@[[CacheCleanerPlugin new], [RetainCycleLoggerPlugin new]] retainCycleDetectorConfiguration:nil]; [memoryProfiler enable]; #endif return YES; } @end 其中,插件是可以不开启的,如果你不想开启的话,你可以这么写:
FBMemoryProfiler *memoryProfiler = [FBMemoryProfiler new]; [memoryProfiler enable]; 插件主要是用来进行过滤、去重或者输出、存储等操作的,毕竟如果不开启插件的话,只能通过在手机、模拟器上点击屏幕来看内存泄露,而如果自定义log插件的话,可以将捕获到的内存泄露输出到控制台或者文件中。
比如说,我们可以自定义一个 RetainCycleLoggerPlugin ,使用 FBMemoryProfilerPluggable 协议,重写 memoryProfilerDidFindRetainCycles: 方法:
- (void)memoryProfilerDidFindRetainCycles:(NSSet *)retainCycles { if (retainCycles.count > 0) { NSLog(@"/nretainCycles = /n%@", retainCycles); } } 当 FBRetainCycleDetector 找到循环引用之后,就会调用到上面的方法,但是, retainCycles 可能是个空集合,所以这里可以过滤一下。
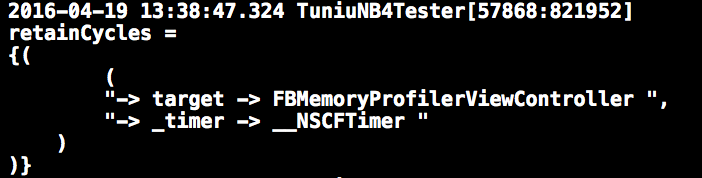
我在测试我的app的时候,发现这样一个问题:
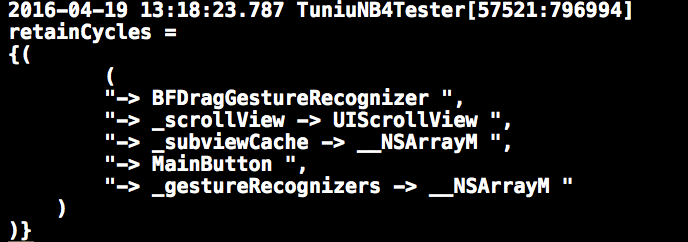
我确信这里没有因为我而导致的循环引用,但是 FBRetainCycleDetector 在这里检测到了这个环,这里的主要问题在于 _subviewCache ,这是苹果的机制,但是并不会造成内存泄露。对于这种情况,我们需要将它过滤出去。
除此之外,还有一个 Timer 的问题,因为一般情况下, Timer 会强引用target,所以可能导致内存泄露,如果你确信没有问题的话,可以关闭对 Timer 的检测。
过滤代码类似于这种:
NSArray *filters = @[FBFilterBlockWithObjectIvarRelation([UIView class], @"_subviewCache")]; FBObjectGraphConfiguration *configuration = [[FBObjectGraphConfiguration alloc] initWithFilterBlocks:filters shouldInspectTimers:YES]; memoryProfiler = [[FBMemoryProfiler alloc] initWithPlugins:@[[CacheCleanerPlugin new], [RetainCycleLoggerPlugin new]] retainCycleDetectorConfiguration:configuration]; [memoryProfiler enable]; 我们只需要设置一个过滤数组,然后添加到 FBMemoryProfiler 的 Configuration 中即可。
对于你确信没有问题或者不想修改的问题,你可以在 Configuration 中直接过滤掉。
比如:
NSArray *filters = @[FBFilterBlockWithObjectIvarRelation([UIPanGestureRecognizer class], @"_internalActiveTouches")]; 如果你有CI的需要,你可以在代理中输出log到文本,之后传出到服务器上。
运行
具体操作可以参考Facebook的视频,上一篇译文中也有给出。
正文到此结束
热门推荐


相关文章


Loading...
![[HBLOG]公众号](http://www.liuhaihua.cn/img/qrcode_gzh.jpg)

