go-chart - 好用的图表开源库
go-chart
Package chart is a very simple golang native charting library that supports timeseries and continuous line charts.
The v1.0 release has been tagged so things should be more or less stable, if something changes please log an issue.
Installation
To install chart run the following:
> go get -u github.com/wcharczuk/go-chart Most of the components are interchangeable so feel free to crib whatever you want.
Output Examples
Spark Lines:

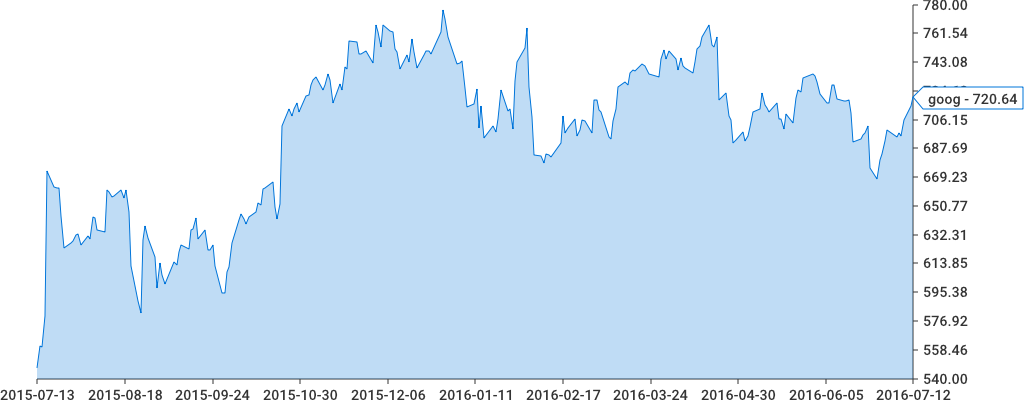
Single axis:
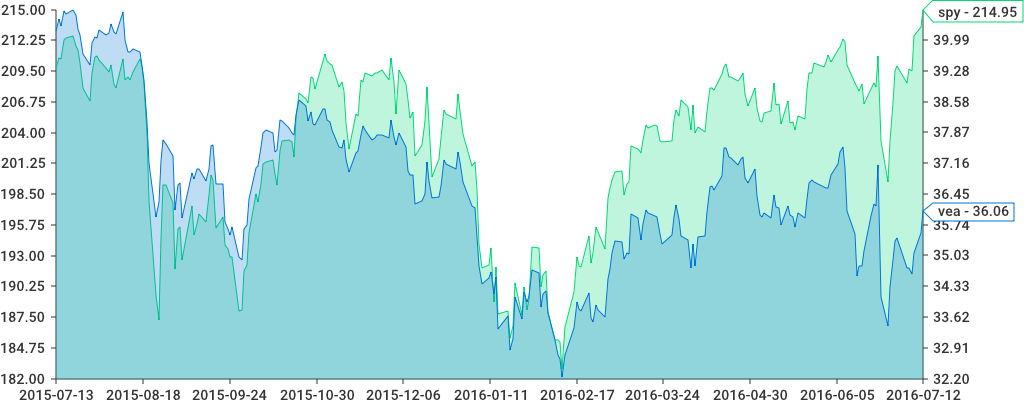
Two axis:
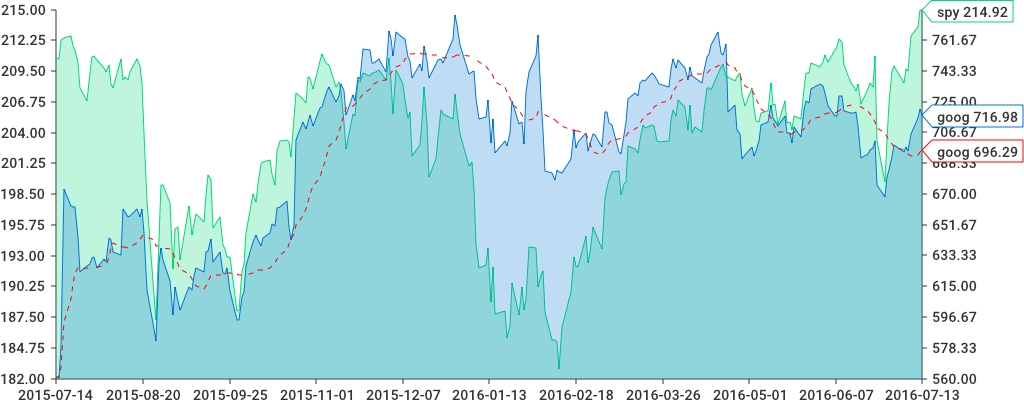
Simple Moving Average:
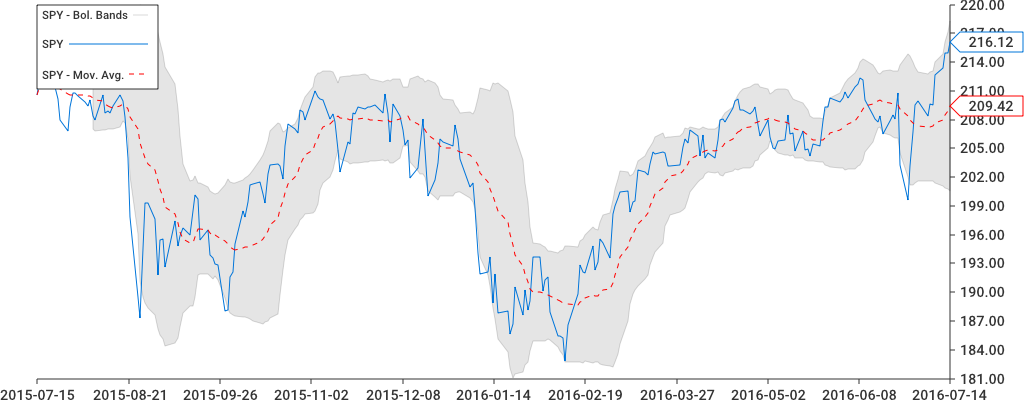
Bollinger Bounds:
Code Examples
Actual chart configurations and examples can be found in the ./examples/ directory. They are web servers, so start them with go run main.go then access http://localhost:8080 to see the output.
Usage
Everything starts with the chart.Chart object. The bare minimum to draw a chart would be the following:
import ( ... "bytes" ... "github.com/wcharczuk/go-chart" //exposes "chart" ) graph := chart.Chart{ Series: []chart.Series{ chart.ContinuousSeries{ XValues: []float64{1.0, 2.0, 3.0, 4.0}, YValues: []float64{1.0, 2.0, 3.0, 4.0}, }, }, } buffer := bytes.NewBuffer([]byte{}) err := graph.Render(chart.PNG, buffer) Explanation of the above: A chart can have many Series , a Series is a collection of things that need to be drawn according to the X range and the Y range(s).
Here, we have a single series with x range values as float64s, rendered to a PNG. Note; we can pass any type of io.Writer into Render(...) , meaning that we can render the chart to a file or a resonse or anything else that implements io.Writer .
API Overview
Everything on the chart.Chart object has defaults that can be overriden. Whenever a developer sets a property on the chart object, it is to be assumed that value will be used instead of the default. One complication here is any object's root chart.Style object (i.e named Style ) and the Show property specifically, if any other property is set and the Show property is unset, it is assumed to be it's default value of False .
The best way to see the api in action is to look at the examples in the ./examples/ directory.
Design Philosophy
I wanted to make a charting library that used only native golang, that could be stood up on a server (i.e. it had built in fonts).
The goal with the API itself is to have the "zero value be useful", and to require the user to not code more than they absolutely needed.
Contributions
This library is super early but contributions are welcome.
正文到此结束
热门推荐


相关文章


Loading...
![[HBLOG]公众号](http://www.liuhaihua.cn/img/qrcode_gzh.jpg)

