Matplotlib 中文用户指南 3.6 图例指南
3.6 图例指南
原文: Legend guide
译者:飞龙
协议: CC BY-NC-SA 4.0
此图例指南是 legend() 中可用文档的扩展 - 请在继续阅读本指南之前确保你熟悉该文档(见篇尾)的内容。
本指南使用一些常见术语,为了清楚起见,这些术语在此处进行说明:
图例条目
图例由一个或多个图例条目组成。 一个条目由一个键和一个标签组成。
图例键
每个图例标签左侧的彩色/图案标记。
图例标签
描述由键表示的句柄的文本。
图例句柄
用于在图例中生成适当条目的原始对象。
控制图例条目
不带参数调用 legend() 会自动获取图例句柄及其相关标签。 此函数等同于:
handles, labels = ax.get_legend_handles_labels()
ax.legend(handles, labels)
get_legend_handles_labels() 函数返回轴域上存在的句柄/artist 的列表,这些句柄/artist 可以用于为结果图例生成条目 - 但值得注意的是,并非所有 artist 都可以添加到图例中, 这种情况下会创建『代理』(请参阅 特地为添加到图例创建 artist(也称为代理 artist) ,来了解更多详细信息)。
为了完全控制要添加到图例的内容,通常将适当的句柄直接传递给 legend() :
line_up, = plt.plot([1,2,3], label='Line 2')
line_down, = plt.plot([3,2,1], label='Line 1')
plt.legend(handles=[line_up, line_down])
在某些情况下,不可能设置句柄的标签,因此可以将标签列表传递给 legend() :
line_up, = plt.plot([1,2,3], label='Line 2')
line_down, = plt.plot([3,2,1], label='Line 1')
plt.legend([line_up, line_down], ['Line Up', 'Line Down'])
特地为添加到图例创建 artist(也称为代理 artist)
并非所有的句柄都可以自动转换为图例条目,因此通常需要创建一个可转换的 artist。 图例句柄不必存在于被用到的图像或轴域上。
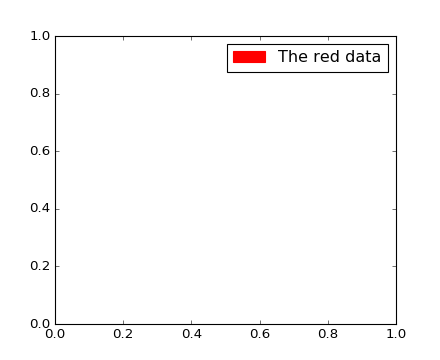
假设我们想创建一个图例,其中有一些数据表示为红色:
import matplotlib.patches as mpatches
import matplotlib.pyplot as plt

red_patch = mpatches.Patch(color='red', label='The red data')
plt.legend(handles=[red_patch])

plt.show()
除了创建一个色块之外,有许多受支持的图例句柄,我们可以创建一个带有标记的线条:
import matplotlib.lines as mlines
import matplotlib.pyplot as plt

blue_line = mlines.Line2D([], [], color='blue', marker='*',
                          markersize=15, label='Blue stars')
plt.legend(handles=[blue_line])

plt.show()
图例位置
图例的位置可以通过关键字参数 loc 指定。 详细信息请参阅 legend() 的文档。
bbox_to_anchor 关键字可让用户手动控制图例布局。 例如,如果你希望轴域图例位于图像的右上角而不是轴域的边角,则只需指定角的位置以及该位置的坐标系:
plt.legend(bbox_to_anchor=(1, 1),
           bbox_transform=plt.gcf().transFigure)
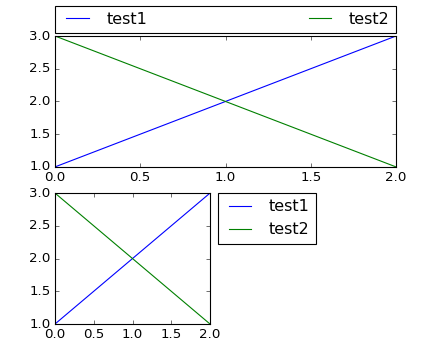
自定义图例位置的更多示例:
import matplotlib.pyplot as plt


plt.subplot(211)
plt.plot([1,2,3], label="test1")
plt.plot([3,2,1], label="test2")
# 将图例放到这个子图上方,
# 扩展自身来完全利用提供的边界框。
plt.legend(bbox_to_anchor=(0., 1.02, 1., .102), loc=3,
           ncol=2, mode="expand", borderaxespad=0.)

plt.subplot(223)
plt.plot([1,2,3], label="test1")
plt.plot([3,2,1], label="test2")
# 将图例放到这个小型子图的右侧
plt.legend(bbox_to_anchor=(1.05, 1), loc=2, borderaxespad=0.)

plt.show()
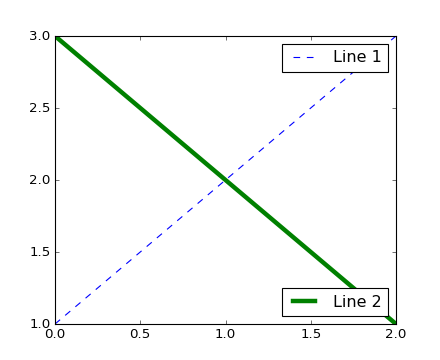
相同轴域内的多个图例
有时,在多个图例之间分割图例条目会更加清晰。 虽然直觉上的做法可能是多次调用 legend() 函数,但你会发现轴域上只存在一个图例。 这样做是为了可以重复调用 legend() ,将图例更新为轴域上的最新句柄,因此要保留旧的图例实例,我们必须将它们手动添加到轴域中:
import matplotlib.pyplot as plt

line1, = plt.plot([1,2,3], label="Line 1", linestyle='--')
line2, = plt.plot([3,2,1], label="Line 2", linewidth=4)

# 为第一个线条创建图例
first_legend = plt.legend(handles=[line1], loc=1)

# 手动将图例添加到当前轴域
ax = plt.gca().add_artist(first_legend)

# 为第二个线条创建另一个图例
plt.legend(handles=[line2], loc=4)

plt.show()
图例处理器
为了创建图例条目,将句柄作为参数提供给适当的 HandlerBase 子类。 处理器子类的选择由以下规则确定:
- 使用
handler_map关键字中的值更新get_legend_handler_map()。 - 检查句柄是否在新创建的
handler_map中。 - 检查句柄的类型是否在新创建的
handler_map中。 - 检查句柄的
mro中的任何类型是否在新创建的handler_map中。
处于完整性,这个逻辑大多在 get_legend_handler() 中实现。
所有这些灵活性意味着我们可以使用一些必要的钩子,为我们自己的图例键类型实现自定义处理器。
使用自定义处理器的最简单的例子是,实例化一个现有的 HandlerBase 子类。 为了简单起见,让我们选择 matplotlib.legend_handler.HandlerLine2D ,它接受 numpoints 参数(出于便利,注意 numpoints 是 legend() 函数上的一个关键字)。 然后我们可以将实例的字典作为关键字 handler_map 传给 legend 。
import matplotlib.pyplot as plt
from matplotlib.legend_handler import HandlerLine2D

line1, = plt.plot([3,2,1], marker='o', label='Line 1')
line2, = plt.plot([1,2,3], marker='o', label='Line 2')

plt.legend(handler_map={line1: HandlerLine2D(numpoints=4)})

如你所见, Line 1 现在有 4 个标记点, Line 2 有两个(默认值)。 尝试上面的代码,只需将字典的键从 line1 更改为type(line) 。 注意现在两个 Line2D`实例都拥有了 4 个标记。
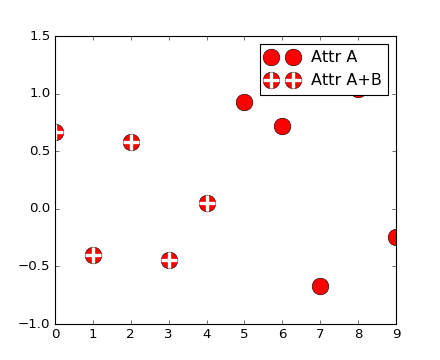
除了用于复杂的绘图类型的处理器,如误差条,茎叶图和直方图,默认的 handler_map 有一个特殊的元组处理器( HandlerTuple ),它简单地在顶部一一绘制给定元组中每个项目的句柄。 以下示例演示如何将两个图例的键相互叠加:
import matplotlib.pyplot as plt
from numpy.random import randn

z = randn(10)

red_dot, = plt.plot(z, "ro", markersize=15)
# 将白色十字放置在一些数据上
white_cross, = plt.plot(z[:5], "w+", markeredgewidth=3, markersize=15)

plt.legend([red_dot, (red_dot, white_cross)], ["Attr A", "Attr A+B"])
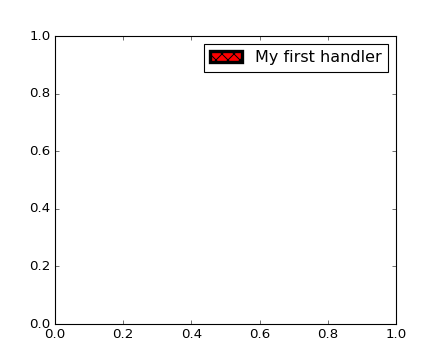
实现自定义图例处理器
可以实现自定义处理器,将任何句柄转换为图例的键(句柄不必要是 matplotlib artist)。 处理器必须实现 legend_artist 方法,该方法为要使用的图例返回单个 artist。 有关 legend_artist 的详细信息,请参阅 legend_artist() 。
import matplotlib.pyplot as plt
import matplotlib.patches as mpatches

class AnyObject(object):
    pass

class AnyObjectHandler(object):
    def legend_artist(self, legend, orig_handle, fontsize, handlebox):
        x0, y0 = handlebox.xdescent, handlebox.ydescent
        width, height = handlebox.width, handlebox.height
        patch = mpatches.Rectangle([x0, y0], width, height, facecolor='red',
                                   edgecolor='black', hatch='xx', lw=3,
                                   transform=handlebox.get_transform())
        handlebox.add_artist(patch)
        return patch

plt.legend([AnyObject()], ['My first handler'],
           handler_map={AnyObject: AnyObjectHandler()})
或者,如果我们想要接受全局的 AnyObject 实例,而不想一直手动设置 handler_map 关键字,我们可以注册新的处理器:
from matplotlib.legend import Legend
Legend.update_default_handler_map({AnyObject: AnyObjectHandler()})
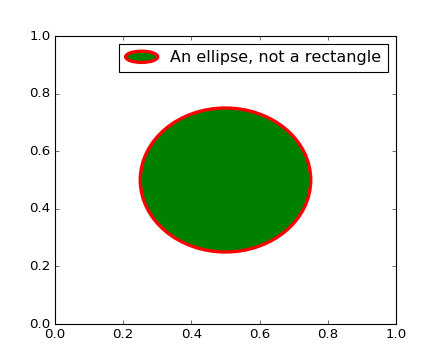
虽然这里的功能十分清楚,请记住,有很多已实现的处理器,你想实现的目标可能易于使用现有的类实现。 例如,要生成椭圆的图例键,而不是矩形键:
from matplotlib.legend_handler import HandlerPatch
import matplotlib.pyplot as plt
import matplotlib.patches as mpatches


class HandlerEllipse(HandlerPatch):
    def create_artists(self, legend, orig_handle,
                       xdescent, ydescent, width, height, fontsize, trans):
        center = 0.5 * width - 0.5 * xdescent, 0.5 * height - 0.5 * ydescent
        p = mpatches.Ellipse(xy=center, width=width + xdescent,
                             height=height + ydescent)
        self.update_prop(p, orig_handle, legend)
        p.set_transform(trans)
        return [p]


c = mpatches.Circle((0.5, 0.5), 0.25, facecolor="green",
                    edgecolor="red", linewidth=3)
plt.gca().add_patch(c)

plt.legend([c], ["An ellipse, not a rectangle"],
           handler_map={mpatches.Circle: HandlerEllipse()})
使用图例的现有示例
这里是一个不太详尽的示例列表,涉及以各种方式使用的图例:
-
lines_bars_and_markers示例代码:scatter_with_legend.py - API 示例代码:
legend_demo.py -
pylab_examples示例代码:contourf_hatching.py -
pylab_examples示例代码:figlegend_demo.py -
pylab_examples示例代码:finance_work2.py -
pylab_examples示例代码:scatter_symbol.py
matplotlib.pyplot.legend(*args, **kwargs) 文档
在轴域上放置一个图例。
为了为轴域上已经存在的线条(例如通过绘图)制作图例,只需使用字符串的可迭代对象(每个图例条目对应一个字符串)调用此函数。 例如:
ax.plot([1, 2, 3])
ax.legend(['A simple line'])
但是,为了使『标签』和图例元素实例保持一致,最好在 artist 创建时指定标签,或者通过调用 artist 的 set_label() 方法:
line, = ax.plot([1, 2, 3], label='Inline label')
# 通过调用该方法覆写标签
line.set_label('Label via method')
ax.legend()
通过定义以下划线开头的标签,可以从图例元素自动选择中排除特定线条。 这对于所有 artist 都是默认的,因此不带任何参数调用 legend() ,并且没有手动设置标签会导致没有绘制图例。
为了完全控制哪些 artist 拥有图例条目,可以传递拥有图例的 artist 的可迭代对象,然后是相应图例标签的可迭代对象:
legend((line1, line2, line3), ('label1', 'label2', 'label3'))
参数
loc :整数、字符串或者浮点偶对,默认为 'upper right' 。
图例的位置。 可能的代码是:
| 位置字符串 | 位置代码 |
|---|---|
'best' |
0 |
'upper right' |
1 |
'upper left' |
2 |
'lower left' |
3 |
'lower right' |
4 |
'right' |
5 |
'center left' |
6 |
'center right' |
7 |
'lower center' |
8 |
'upper center' |
9 |
'center' |
10 |
或者,可以是一个二元组,提供图例的距离左下角的 x, y 坐标(在这种情况下, bbox_to_anchor 将被忽略)。
bbox_to_anchor : matplotlib.transforms.BboxBase 示例或者浮点元组。
在 bbox_transform 坐标(默认轴域坐标)中为图例指定任意位置。
例如,要将图例的右上角放在轴域中心,可以使用以下关键字:
loc='upper right', bbox_to_anchor=(0.5, 0.5)
ncol :整数。
图例的列数,默认为 1。
prop : None 、 matplotlib.font_manager.FontProperties 或者字典。
图例的字体属性,如果为 None (默认),会使用当前的 matplotlib.rcParams 。
fontsize :整数、浮点或者 {‘xx-small’, ‘x-small’, ‘small’, ‘medium’, ‘large’, ‘x-large’, ‘xx-large’} 。
控制图例的字体大小。 如果值为数字,则大小将为绝对字体大小(以磅为单位)。 字符串值相对于当前默认字体大小。 此参数仅在未指定 prop 的情况下使用。
numpoints : None 或者整数。
为线条/ matplotlib.lines.Line2D 创建图例条目时,图例中的标记点数。 默认值为 None ,它将从 legend.numpoints rcParam 中获取值。
scatterpoints : None 或者整数。
为散点图/ matplotlib.collections.PathCollection 创建图例条目时,图例中的标记点数。 默认值为 None ,它将从 legend.scatterpoints rcParam 中获取值。
scatteryoffsets :浮点的可迭代对象。
为散点图图例条目创建的标记的垂直偏移量(相对于字体大小)。 0.0 是在图例文本的底部,1.0 是在顶部。 为了将所有标记绘制在相同的高度,请设置为 [0.5] 。 默认值为 [0.375,0.5,0.3125] 。
markerscale : None 、整数或者浮点。
图例标记对于原始绘制的标记的相对大小。 默认值为 None ,它将从 legend.markerscale rcParam 中获取值。
markerfirst : [ True | False ]
如果为 True ,则图例标记位于图例标签的左侧,如果为 False ,图例标记位于图例标签的右侧。
frameon : None 或布尔值
控制是否应在图例周围绘制框架。 默认值为 None ,它将从 legend.frameon rcParam 中获取值。
fancybox : None 或布尔值
控制是否应在构成图例背景的 FancyBboxPatch 周围启用圆边。 默认值为 None ,它将从 legend.fancybox rcParam 中获取值。
shadow : None 或布尔值
控制是否在图例后面画一个阴影。 默认值为 None ,它将从 legend.shadow rcParam 中获取值。
framealpha : None 或浮点
控制图例框架的 Alpha 透明度。 默认值为 None ,它将从 legend.framealpha rcParam 中获取值。
mode : {"expand", None}
如果 mode 设置为 "expand" ,图例将水平扩展来填充轴域区域(如果定义图例的大小,则为 bbox_to_anchor )。
bbox_transform : None 或者 matplotlib.transforms.Transform
边界框的变换( bbox_to_anchor )。 对于 None 值(默认),将使用 Axes 的 transAxes 变换。
title :字符串或者 None
图例的标题,默认没有标题( None )。
borderpad :浮点或 None
图例边框的内边距。 以字体大小为单位度量。 默认值为 None ,它将从 legend.borderpad rcParam 中获取值。
labelspacing :浮点或 None
图例条目之间的垂直间距。 以字体大小为单位度量。 默认值为 None ,它将从 legend.labelspacing rcParam 中获取值。
handlelength :浮点或 None
图例句柄的长度。 以字体大小为单位度量。 默认值为 None ,它将从 legend.handlelength rcParam 取值。
handletextpad :浮点或 None
图例句柄和文本之间的间距。 以字体大小为单位度量。 默认值为 None ,它将从 legend.handletextpad rcParam 中获取值。
borderaxespad :浮点或 None
轴和图例边框之间的间距。 以字体大小为单位度量。 默认值为 None ,它将从 legend.borderaxespad rcParam 中获取值。
columnspacing :浮点或 None
列间距。以字体大小为单位度量。 默认值为 None ,它将从 legend.columnspacing rcParam 中获取值。
handler_map :字典或 None
自定义字典,用于将实例或类型映射到图例处理器。 这个 handler_map 会更新在 matplotlib.legend.Legend.get_legend_handler_map() 中获得的默认处理器字典。
正文到此结束
热门推荐


相关文章

近期评论
-
你这基本没有更新呀,最近文章显示还是2019年的文章。不符合要求哈
-
关键词:慕云博客 链接:https://www.lilun.me 描述:分享原创文字的个人博客
-
-
-
可以提供一下源码吗
-
不是商业站,鸡娃学习笔记
-
-
-
-
听他们说很厉害的样子
Loading...
![[HBLOG]公众号](http://www.liuhaihua.cn/img/qrcode_gzh.jpg)

