【MySQL】一条SQL使磁盘暴涨并导致MySQL Crash
收到一个MySQL实例的磁盘告警,看到监控图,磁盘使用率增长速度非常快,在两个多小时的时间里,已经涨了170多G。
检查到binlog目录并不大,而datadir已经180多G了,发现ibtmp1非常大,并且持续增长。
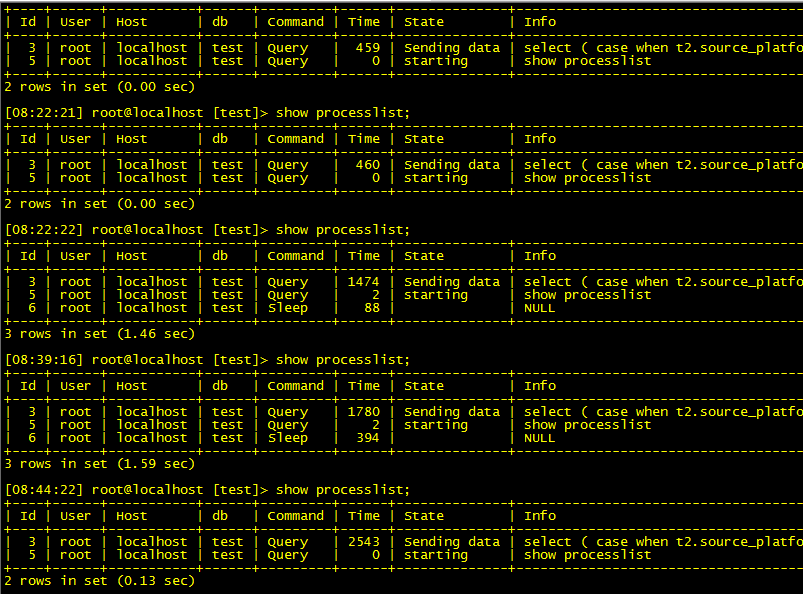
赶紧上去看processlist,线程不多,检查到有一个SELECT case ... when ... 的线程,状态是sending data,并且已经持续几千秒了。
有点懵,没有第一时间kill掉这个线程,再一次show processlist的时候……发现大概已经挂了………………
那好,既然已经挂了,那么开始找原因吧…
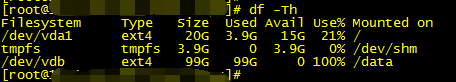
看一下datadir挂载的磁盘,已经释放空了,果然已经被重启了。
ext4 197G 4.6G 191G 3% $datadir
检查一下mysqld进程,发现已经被mysqld_safe拉起来了。
检查一下error log:
红字是关于mysqld crash的信息,很显然,datadir挂载的磁盘满了。
没有多余的空间写binlog和ibtmp1临时表空间文件(5.7新增)。
而且ibtmp1文件最后达到了201876045824bytes,将近190G,而挂载的磁盘总大小才不到200G。
蓝字是关于sql thread的问题,在mysqld起来之后,sql thread也出现了问题。
这个之后再修复。
因为已经挂了,而且没有来得及将当时执行的sql完整记录下来,只能看到show processlist前面的一小部分。
联系到业务,业务说这一台是slave,无读的业务,但偶尔会手动执行报表相关的SELECT操作。
那么检查一下crash前的两个小时的slow log:
发现反复有这么几条SQL:
虽然没有一条超过20秒的,但不要忘了,在磁盘被打爆之前的一秒,有一条执行了几千秒的SQL。
并且case when只有一个order by。
出于取出其中一条,检查一下执行计划:
看起来不是很好,但是也不至于用到190G临时表。
虽然临时表是长期积累下来的,但看监控,磁盘使用率确实是在这一个多小时迅速积攒起来的。
首先这个从库是没有业务的,而是通过客户那边可能手动连接过来做一些查询服务的。
知道这个信息之后,继续对照slow log,发现slow log关于case when的这一条sql并不完全一样……
这可能意味着客户仍然在不停地调试这条SQL…
而那条执行了几千秒的case when可能写得十分烂。
可惜的是,在mysqld crash的最后一瞬间,该sql仍然没有执行完成,导致没有被记录到slow log。
那条sql估计也永远无法再复现。
那么究竟是多烂的SQL,或者多大的表,可以用到这么多基于磁盘的临时表或文件排序呢??
赶紧检查一下库表的情况:
① 表1:100w,表2:40w,也没有blob,text等字段。
② 重启后的datadir只有3、4G的数据量
所以我有个大但的想法:
可能客户在调试的过程中,产生了一条类似这样的SQL:
我对照了已经记录在slow log的几条sql,脱敏,格式化之后还原如下:
对,这两张表做了一个JOIN,但是没有条件。
产生了一个很大很大很大的笛卡尔积。
那么算一下:
列:13 + 19 = 32
行: 1088181*440650 = 479,506,957,650 rows
再测试一下:
将两张表dump成sql文件,看了一下大小:330MB,并不大。
导入自己的实验环境,再将上述产生笛卡尔积的SQL跑一下。
经过一段时间等待:
已经执行了半个小时多了。并且该SQL仍然在执行:
说出来你们可能不信,此时的ibtmp1大小:
大概也好解释,为什么两张并不是很大的表,在执行某些查询之后会产生这么大的临时表了…
当然,在做实验的等待时间里,已经将复制的ERROR给修复了。
当时复制的报错:
结合之前贴的error log可以看到更多信息,推断是relay log有损坏。
那么就好解决了:
此处不再赘述。
到目前为止,我实验环境的datadir已经满了,但是和此处正式环境有区别的是。
在磁盘写满之时,并没有马上导致mysql crash,而是输出了:
实际上正常情况下,mysql在磁盘满了的情况下,会每隔1分钟做一次检查,每隔10分钟将检查信息输出到错误日志。
既然mysqld没有被干掉,我再次执行了一下那条可怕的sql呢?……
当然……error log如愿输出被kill的消息……
并且mysqld进程被杀掉,此时:
有趣的是,“information”这个单词都没有输出完,大概是真的一个字符都写不下了吧。
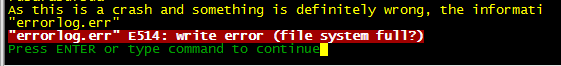
试图用vim在error log里添加几个字符并保存,也报错。
那么总结一下,供参考:
〇 在线上环境执行的sql,建议进行审核,报表等OLAP需求也需要正式一些。
〇 考虑是否可以限制ibtmp1的大小,也就是设定innodb_temp_data_file_path的最大值。
〇 可能需要定期重启mysqld来收缩临时表空间。
〇 做好监控和及时响应,这次就是响应时间过长,达到阈值,然后到机子上检查时,已经晚了,眼睁睁地看到mysqld在我眼前crash。
检查到binlog目录并不大,而datadir已经180多G了,发现ibtmp1非常大,并且持续增长。
赶紧上去看processlist,线程不多,检查到有一个SELECT case ... when ... 的线程,状态是sending data,并且已经持续几千秒了。
有点懵,没有第一时间kill掉这个线程,再一次show processlist的时候……发现大概已经挂了………………
-
mysql> show processlist;
-
ERROR 2006 (HY000): MySQL server has gone away
-
No connection. Trying to reconnect...
-
ERROR 2002 (HY000): Can't connect to local MySQL server through socket '$datadir/mysqld.sock' (2)
- ERROR: Can't connect to the server
那好,既然已经挂了,那么开始找原因吧…
看一下datadir挂载的磁盘,已经释放空了,果然已经被重启了。
ext4 197G 4.6G 191G 3% $datadir
检查一下mysqld进程,发现已经被mysqld_safe拉起来了。
检查一下error log:
红字是关于mysqld crash的信息,很显然,datadir挂载的磁盘满了。
没有多余的空间写binlog和ibtmp1临时表空间文件(5.7新增)。
而且ibtmp1文件最后达到了201876045824bytes,将近190G,而挂载的磁盘总大小才不到200G。
蓝字是关于sql thread的问题,在mysqld起来之后,sql thread也出现了问题。
这个之后再修复。
- [ERROR] InnoDB: posix_fallocate(): Failed to preallocate data for file $datadir/ibtmp1, desired size 67108864 bytes. Operating system error number 28. Check that the disk is not full or a disk quota exceeded. Make sure the file system supports this function. Some operating system error numbers are described at http://dev.mysql.com/doc/refman/5.7/en/ operating-system-error-codes.html
- [ERROR] Disk is full writing '$datadir/mysql-bin.000004' (Errcode: 15870576 - No space left on device). Waiting for someone to free space...
- [ERROR] Retry in 60 secs. Message reprinted in 600 secs
- [Warning] InnoDB: 1048576 bytes should have been written. Only 647168 bytes written. Retrying for the remaining bytes.
- [Warning] InnoDB: Retry attempts for writing partial data failed.
- [ERROR] InnoDB: Write to file $datadir/ibtmp1 failed at offset 201911697408, 1048576 bytes should have been written, only 647168 were written. Operating system error number 28. Check that your OS and file system support files of this size. Check also that the disk is not full or a disk quota exceeded.
- [ERROR] InnoDB: Error number 28 means 'No space left on device'
- [Note] InnoDB: Some operating system error numbers are described at http://dev.mysql.com/doc/refman/5.7/en/operating-system-error-codes.html
- [Warning] InnoDB: Error while writing 67108864 zeroes to $datadir/ibtmp1 starting at offset 201876045824
- [ERROR] $basedir/bin/mysqld: The table '$tmpdir/#sql_37c5_0' is full
- [ERROR] InnoDB: posix_fallocate(): Failed to preallocate data for file ./thread_quartz/QRTZ_FIRED_TRIGGERS.ibd, desired size 32768 bytes. Operating system error number 28. Check that the disk is not full or a disk quota exceeded. Make sure the file system supports this function. Some operating system error numbers are described at http://dev.mysql.com/doc/refman/5.7/en/ operating-system-error-codes.html
- [Warning] InnoDB: Retry attempts for writing partial data failed.
- [Warning] InnoDB: Error while writing 32768 zeroes to ./thread_quartz/QRTZ_FIRED_TRIGGERS.ibd starting at offset 442362017-07-06T11:49:21.893377Z mysqld_safe Number of processes running now: 0
- mysqld_safe mysqld restarted
- ……………………………………………………………………………………………………………………
- [Note] InnoDB: Last MySQL binlog file position 0 690908428, file name mysql-bin.000004
- [Note] InnoDB: Starting in background the rollback of uncommitted transactions
- [Note] InnoDB: Rollback of non-prepared transactions completed
- [Note] InnoDB: Removed temporary tablespace data file: "ibtmp1"
- [Note] InnoDB: Creating shared tablespace for temporary tables
- [Note] InnoDB: Setting file '$datadir/ibtmp1' size to 12 MB. Physically writing the file full; Please wait ...
- [Note] InnoDB: File '$datadir/ibtmp1' size is now 12 MB.
- [Note] InnoDB: 96 redo rollback segment(s) found. 96 redo rollback segment(s) are active.
- [Note] InnoDB: 32 non-redo rollback segment(s) are active.
- [Note] InnoDB: Waiting for purge to start
- [Note] InnoDB: 5.7.12 started; log sequence number 4828513952
- [Note] InnoDB: page_cleaner: 1000ms intended loop took 7748ms. The settings might not be optimal. (flushed=0 and evicted=0, during the time.)
- [Note] InnoDB: Loading buffer pool(s) from $datadir/ib_buffer_pool
- [Note] Plugin 'FEDERATED' is disabled.
- [Note] InnoDB: Buffer pool(s) load completed at 170706 19:49:30
- [Note] Recovering after a crash using $basedir/mysql-bin
- [ERROR] Error in Log_event::read_log_event(): 'read error', data_len: 579, event_type: 2
- [Note] Starting crash recovery...
- [Note] InnoDB: Starting recovery for XA transactions...
- [Note] InnoDB: Transaction 6729603 in prepared state after recovery
- [Note] InnoDB: Transaction contains changes to 1 rows
- [Note] InnoDB: 1 transactions in prepared state after recovery
- [Note] Found 1 prepared transaction(s) in InnoDB
- [Note] Crash recovery finished.
- [Note] Crashed binlog file $basedir/mysql-bin.000004 size is 690909184, but recovered up to 690908428. Binlog trimmed to 690908428 bytes.
- [Warning] Failed to set up SSL because of the following SSL library error: SSL context is not usable without certificate and private key
- ……………………………………………………………………………………………………………………
- [ERROR] Error in Log_event::read_log_event(): 'read error', data_len: 835, event_type: 2
- [Warning] Error reading GTIDs from relaylog: -1
- [Note] Slave I/O thread: Start asynchronous replication to master '*****' in log 'mysql-bin.000014' at position 286486095
- [Warning] Storing MySQL user name or password information in the master info repository is not secure and is therefore not recommended. Please consider using the USER and PASSWORD connection options for START SLAVE; see the 'START SLAVE Syntax' in the MySQL Manual for more information.
- [Note] Slave I/O thread for channel '': connected to master '*****',replication started in log 'mysql-bin.000014' at position 286486095
- [Warning] Slave SQL for channel '': If a crash happens this configuration does not guarantee that the relay log info will be consistent, Error_code: 0
- [Note] Slave SQL thread for channel '' initialized, starting replication in log 'mysql-bin.000014' at position 286485153, relay log '$datadir/mysql-relay.000013' position: 286485326
- [ERROR] Error in Log_event::read_log_event(): 'read error', data_len: 835, event_type: 2
- [ERROR] Error reading relay log event for channel '': slave SQL thread aborted because of I/O error
- [ERROR] Slave SQL for channel '': Relay log read failure: Could not parse relay log event entry. The possible reasons are: the master's binary log is corrupted (you can check this by running 'mysqlbinlog' on the binary log), the slave's relay log is corrupted (you can check this by running 'mysqlbinlog' on the relay log), a network problem, or a bug in the master's or slave's MySQL code. If you want to check the master's binary log or slave's relay log, you will be able to know their names by issuing 'SHOW SLAVE STATUS' on this slave. Error_code: 1594
- [ERROR] Error running query, slave SQL thread aborted. Fix the problem, and restart the slave SQL thread with "SLAVE START". We stopped at log 'mysql-bin.000014' position 286485153
- [Note] Event Scheduler: Loaded 0 events
- [Note] $basedir/mysqld: ready for connections.
- Version: '5.7.12' socket: '$datadir/mysqld.sock' port: 3306 Source distribution
因为已经挂了,而且没有来得及将当时执行的sql完整记录下来,只能看到show processlist前面的一小部分。
联系到业务,业务说这一台是slave,无读的业务,但偶尔会手动执行报表相关的SELECT操作。
那么检查一下crash前的两个小时的slow log:
发现反复有这么几条SQL:
- ……………………
- 00:00:11.392881 select * from tb ……………………
-
00:00:04.779748 select (case when ……………………
-
00:00:04.779748 select ( case when t2.col1 ……………………
-
00:00:03.328248 select ( case when t2.col1 ……………………
- 00:00:04.276773 select count(t1.id) from tb1
- 00:00:05.039027 select (case when t2.col ……………………
- 00:00:10.263063 select (case when t2.col ……………………
- 00:00:03.131713 select t2.* from tb1 t1 ……………………
- 00:00:15.909456 select t2.* from tb1 t1 ……………………
-
00:00:14.367047 select * from tb ……………………
- ……………………
虽然没有一条超过20秒的,但不要忘了,在磁盘被打爆之前的一秒,有一条执行了几千秒的SQL。
并且case when只有一个order by。
出于取出其中一条,检查一下执行计划:
-
+--------+---------------+---------+---------+---------------------+--------+----------+----------------------------------------------+
-
| type | possible_keys | key | key_len | ref | rows | filtered | Extra |
-
+--------+---------------+---------+---------+---------------------+--------+----------+----------------------------------------------+
-
| ALL | NULL | NULL | NULL | NULL | 472765 | 20.99 | Using where; Using temporary; Using filesort |
-
| eq_ref | PRIMARY | PRIMARY | 8 | $tb1.col1 | 1 | 10.00 | Using where |
- +--------+---------------+---------+---------+---------------------+--------+----------+----------------------------------------------+
看起来不是很好,但是也不至于用到190G临时表。
虽然临时表是长期积累下来的,但看监控,磁盘使用率确实是在这一个多小时迅速积攒起来的。
首先这个从库是没有业务的,而是通过客户那边可能手动连接过来做一些查询服务的。
知道这个信息之后,继续对照slow log,发现slow log关于case when的这一条sql并不完全一样……
这可能意味着客户仍然在不停地调试这条SQL…
而那条执行了几千秒的case when可能写得十分烂。
可惜的是,在mysqld crash的最后一瞬间,该sql仍然没有执行完成,导致没有被记录到slow log。
那条sql估计也永远无法再复现。
那么究竟是多烂的SQL,或者多大的表,可以用到这么多基于磁盘的临时表或文件排序呢??
赶紧检查一下库表的情况:
① 表1:100w,表2:40w,也没有blob,text等字段。
② 重启后的datadir只有3、4G的数据量
所以我有个大但的想法:
可能客户在调试的过程中,产生了一条类似这样的SQL:
我对照了已经记录在slow log的几条sql,脱敏,格式化之后还原如下:
-
SELECT ( CASE
-
WHEN t2.col='$info_000' THEN '$a'
-
WHEN t2.col='$info_001' THEN '$b'
-
WHEN t2.col='$info_002' THEN '$c'
-
WHEN t2.col='$info_003' THEN '$d'
-
WHEN t2.col='$info_004' THEN '$e'
-
WHEN t2.col='$info_005' THEN '$f'
-
WHEN t2.col='$info_006' THEN '$g'
-
ELSE t2.col
-
END ) AS 来源XX,
-
( CASE
-
WHEN t2.clo2='$info_000' THEN '$a'
-
WHEN t2.clo2='$info_001' THEN '$b'
-
WHEN t2.clo2='$info_002' THEN '$c'
-
WHEN t2.clo2='$info_003' THEN '$d'
-
WHEN t2.clo2='$info_004' THEN '$e'
-
WHEN t2.clo2='$info_005' THEN '$f'
-
WHEN t2.clo2='$info_006' THEN '$g'
- ELSE t2.col
-
END ) AS 目标XX,
-
t2.col4 AS XX时间,
-
t2.col5 AS 金额
-
FROM $tb1 t1 JOIN $tb2 t2
-
WHERE t1.col3 = 4 AND (t2.col LIKE '$info%' OR t2.clo2 LIKE '$info%')
- ORDER BY t1.col4 DESC;
对,这两张表做了一个JOIN,但是没有条件。
产生了一个很大很大很大的笛卡尔积。
那么算一下:
列:13 + 19 = 32
行: 1088181*440650 = 479,506,957,650 rows
再测试一下:
将两张表dump成sql文件,看了一下大小:330MB,并不大。
导入自己的实验环境,再将上述产生笛卡尔积的SQL跑一下。
经过一段时间等待:
已经执行了半个小时多了。并且该SQL仍然在执行:
说出来你们可能不信,此时的ibtmp1大小:
-
# du -sh *
-
4.0K auto.cnf
-
4.0K ib_buffer_pool
-
2.9G ibdata1
-
48M ib_logfile0
-
48M ib_logfile1
-
54G ibtmp1
-
12M mysql
-
1.1M performance_schema
-
676K sys
-
633M test
- 47M test_2
大概也好解释,为什么两张并不是很大的表,在执行某些查询之后会产生这么大的临时表了…
当然,在做实验的等待时间里,已经将复制的ERROR给修复了。
当时复制的报错:
- ……
- Slave_IO_Running: Yes
- Slave_SQL_Running: No
- ……
- Seconds_Behind_Master: NULL
- Master_SSL_Verify_Server_Cert: No
- Last_IO_Errno: 0
- Last_IO_Error:
- Last_SQL_Errno: 1594
- Last_SQL_Error: Relay log read failure: Could not parse relay log event entry. The possible reasons are: the master's binary log is corrupted (you can check this by running 'mysqlbinlog' on the binary log), the slave's relay log is corrupted (you can check this by running 'mysqlbinlog' on the relay log), a network problem, or a bug in the master's or slave's MySQL code. If you want to check the master's binary log or slave's relay log, you will be able to know their names by issuing 'SHOW SLAVE STATUS' on this slave.
那么就好解决了:
-
STOP SLAVE;
-
-
-- master_log_file和master_log_pos为报错时所记录的位置。
-
CHANGE MASTER master_log_file='xxx', master_log_pos=xxx;
-
- START SLAVE;
到目前为止,我实验环境的datadir已经满了,但是和此处正式环境有区别的是。
在磁盘写满之时,并没有马上导致mysql crash,而是输出了:
-
[ERROR] InnoDB: Write to file ./ibtmp1failed at offset 83579895808, 1048576 bytes should have been written, only 958464 were written. Operating system error number 28. Check that your OS and file system support files of this size. Check also that the disk is not full or a disk quota exceeded.
-
[ERROR] InnoDB: Error number 28 means 'No space left on device'
-
[Note] InnoDB: Some operating system error numbers are described at http://dev.mysql.com/doc/refman/5.7/en/operating-system-error-codes.html
-
[Warning] InnoDB: Error while writing 67108864 zeroes to ./ibtmp1 starting at offset 83563118592
-
[ERROR] /data/mysql-base/mysql57/bin/mysqld: The table '#sql_b26_0' is full
-
[ERROR] Disk is full writing '/data/mysql-data/mysql57-3357/binlog/mysql-bin.000015' (Errcode: 15868064 - No space left on device). Waiting for someone to free space...
- [ERROR] Retry in 60 secs. Message reprinted in 600 secs
既然mysqld没有被干掉,我再次执行了一下那条可怕的sql呢?……
当然……error log如愿输出被kill的消息……
并且mysqld进程被杀掉,此时:
-
[ERROR] /data/mysql-base/mysql57/bin/mysqld: Binary logging not possible. Message: An error occurred during flush stage of the commit. 'binlog_error_action' is set to 'ABORT_SERVER'. Hence aborting the server.
-
14:42:48 UTC - mysqld got signal 6 ;
-
This could be because you hit a bug. It is also possible that this binary
-
or one of the libraries it was linked against is corrupt, improperly built,
-
or misconfigured. This error can also be caused by malfunctioning hardware.
-
Attempting to collect some information that could help diagnose the problem.
- As this is a crash and something is definitely wrong, the informati
试图用vim在error log里添加几个字符并保存,也报错。
那么总结一下,供参考:
〇 在线上环境执行的sql,建议进行审核,报表等OLAP需求也需要正式一些。
〇 考虑是否可以限制ibtmp1的大小,也就是设定innodb_temp_data_file_path的最大值。
〇 可能需要定期重启mysqld来收缩临时表空间。
〇 做好监控和及时响应,这次就是响应时间过长,达到阈值,然后到机子上检查时,已经晚了,眼睁睁地看到mysqld在我眼前crash。
正文到此结束
- 本文标签: src Logging bug tar IDE parse mysql-bin.0000 lib trigger id 数据 HTML SQL Server dist Quartz Master db 调试 App 总结 schema mysql-bin IO tab UI operating system REST MySQL5 ACE plugin 测试 sql 空间 list Sending data Word ORM ssl cat 时间 key http Action 目录 进程 需求 实例 show processlist ECS message mysql 线程 NSA Select Connection
- 版权声明: 本文为互联网转载文章,出处已在文章中说明(部分除外)。如果侵权,请联系本站长删除,谢谢。
- 本文海报: 生成海报一 生成海报二
热门推荐


相关文章


Loading...
![[HBLOG]公众号](http://www.liuhaihua.cn/img/qrcode_gzh.jpg)

