SpringBoot 如何加入 Prometheus & Grafana 監控
基本都是要用 SpringBoot2 了啊, 就不要想問 1.x 版了
SpringBoot
1.增加套件依賴
pom.xml
<dependency>
    <groupId>org.springframework.boot</groupId>
    <artifactId>spring-boot-starter-actuator</artifactId>
</dependency>


<dependency>
    <groupId>io.micrometer</groupId>
    <artifactId>micrometer-registry-prometheus</artifactId>
</dependency>
actuator 是 SpringBoot 提供管理與監控的基礎套件
micrometer-registry-prometheus 則是將 Spring 的監控資訊轉成 Prometheus 可以吃的格式
2.配置
bootstrap-prod.yml
management:

  endpoints:

    web:

      exposure:

        include: '*'

  endpoint:

    shutdown:

      enabled: false
Spring 預設只暴露兩個 監控指標 health 跟 info, 如果沒有太多考量的話可以用 * 來暴露所有的
3.重新打包
Done!
Spring 的部分就結束了
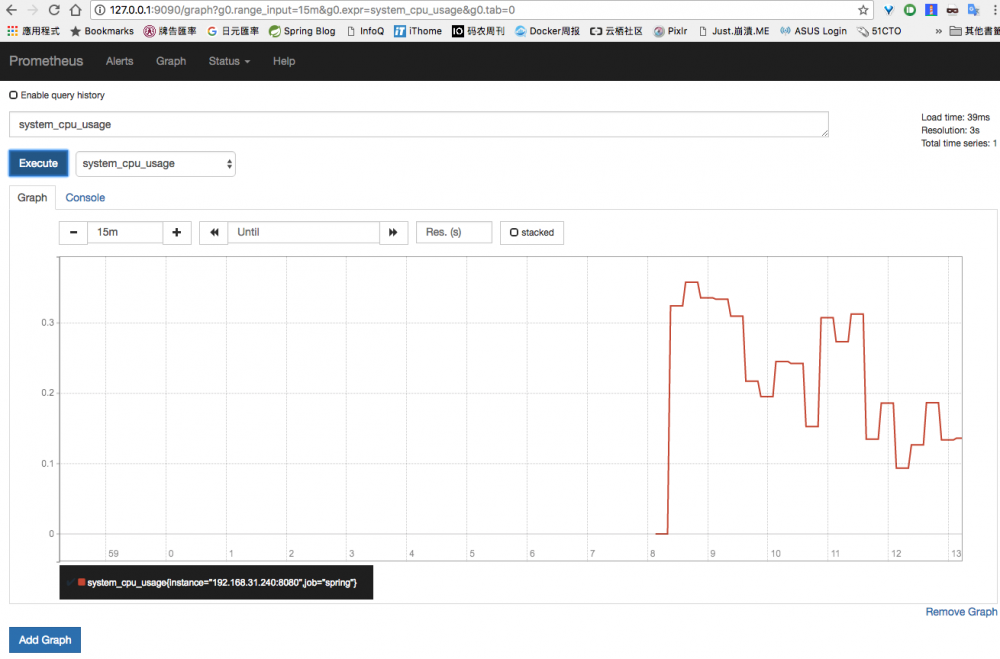
你可以實際測試一下監控點
curl -X GET /
  http://127.0.0.1:8080/actuator/prometheus
得到會是這樣的資料
# HELP jvm_buffer_count An estimate of the number of buffers in the pool
# TYPE jvm_buffer_count gauge
jvm_buffer_count{id="direct",} 1.0
jvm_buffer_count{id="mapped",} 0.0
# HELP http_server_requests_seconds
# TYPE http_server_requests_seconds summary
Prometheus
接下來需要 Prometheus 來把監控數據拉回去儲存
1.配置檔
首先你必須準備個 prometheus.yml 配置檔
prometheus.yml
# my global config

global:

  scrape_interval:     15s # Set the scrape interval to every 15 seconds. Default is every 1 minute.

  evaluation_interval: 15s # Evaluate rules every 15 seconds. The default is every 1 minute.

  # scrape_timeout is set to the global default (10s).


# A scrape configuration containing exactly one endpoint to scrape:

# Here it's Prometheus itself.

scrape_configs:

  - job_name: 'prometheus'

    static_configs:

      - targets: ['localhost:9090']

  - job_name: 'springboot'

    metrics_path: '/actuator/prometheus'

    static_configs:

      - targets: ['127.0.0.1:8080']
這是最簡單的範例, 也不做 alert 了, 交給 Grafana 處理就好, 很多服務就 job_name 一直往下加就可以了
2.啟動
直接啟動
docker run -p 9090:9090 -v /Users/sam/temp/prometheus.yml:/etc/prometheus/prometheus.yml /
  prom/prometheus
需要儲存數據 要先把要掛進去的資料夾處理一下
sudo chown -R 65534 /prometheus/data
再啟動
docker run -d -p 9090:9090 /
  -v /prometheus/prometheus.yml:/etc/prometheus/prometheus.yml /
  -v /prometheus/data:/prometheus /
  prom/prometheus --web.enable-lifecycle --config.file=/etc/prometheus/prometheus.yml
http://localhost:9090/graph
Grafana
Grafana 我就沒有自己建, 要自己建立的話在網路找一下吧
要使用我們剛剛建立的 Prometheus 數據
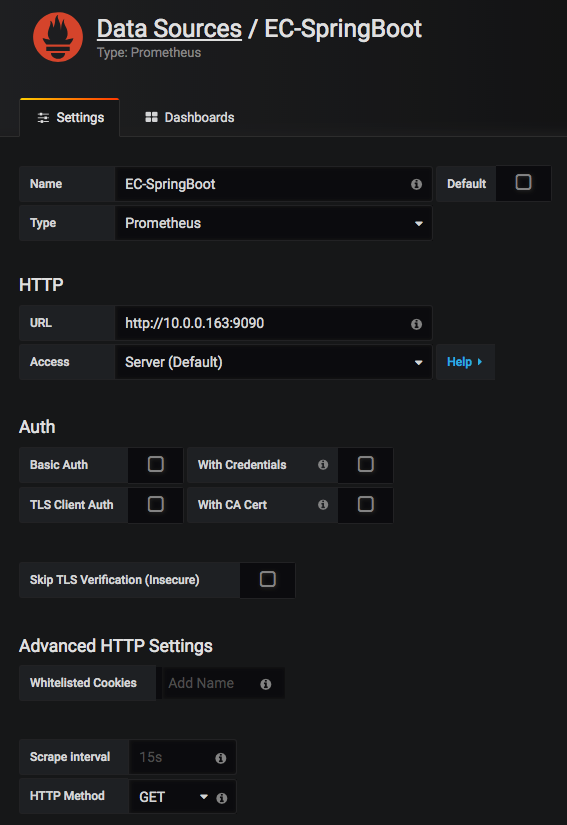
1.增加數據源
Configuration -> Add data source
2.新增面板
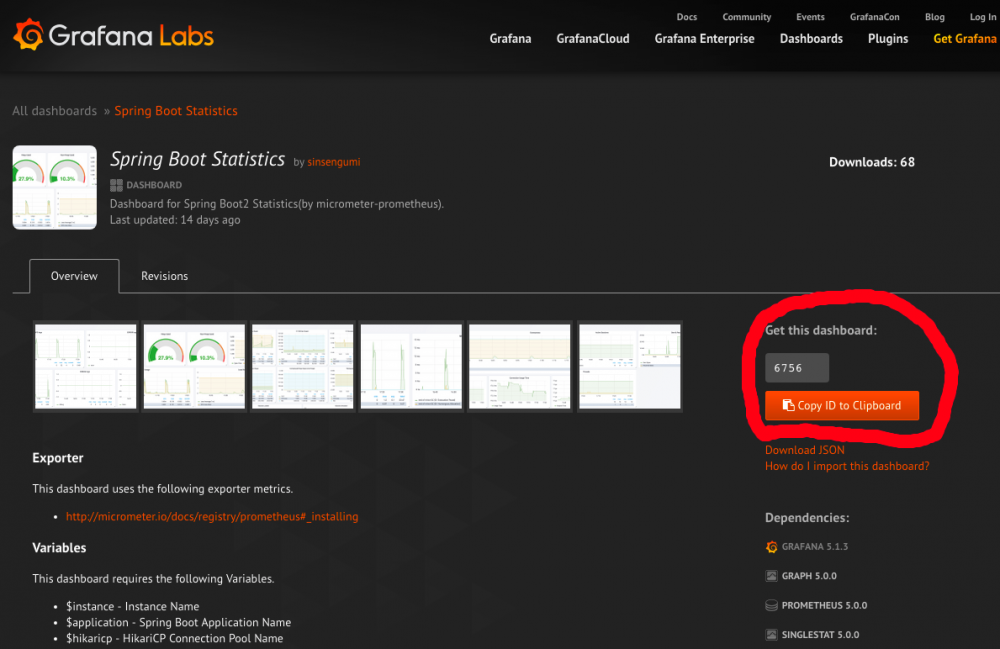
在 https://grafana.com/dashboards 搜尋 spring 或是 jvm
都有人做好現成的, 只要複製 dashboard id
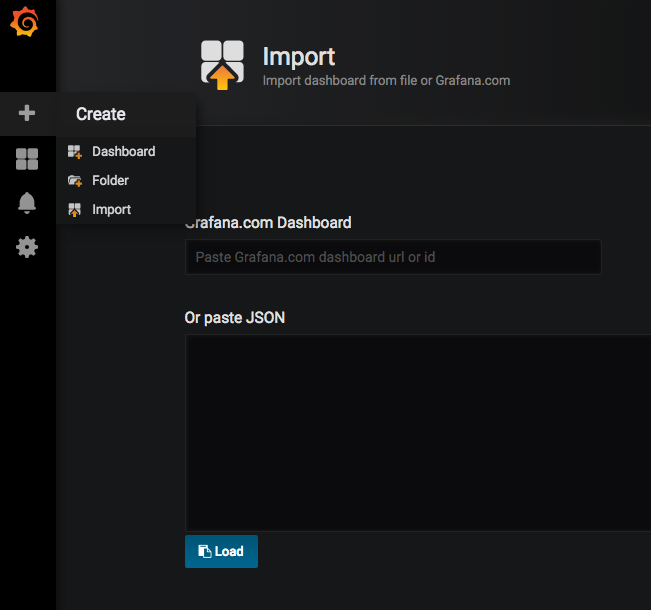
在左邊列表選 Create → Import 輸入你要的 id , 再選一下 Prometheus data source
立馬完成一個功能齊全的監控中心啊
https://i.imgur.com/TETvXdo.png正文到此结束
热门推荐


相关文章

近期评论
-
你这基本没有更新呀,最近文章显示还是2019年的文章。不符合要求哈
-
关键词:慕云博客 链接:https://www.lilun.me 描述:分享原创文字的个人博客
-
-
-
可以提供一下源码吗
-
不是商业站,鸡娃学习笔记
-
-
-
-
听他们说很厉害的样子
Loading...
![[HBLOG]公众号](http://www.liuhaihua.cn/img/qrcode_gzh.jpg)

