Kafka使用jmxtrans+influxdb+grafana监控JMX指标
最近在搞Kafka集群监控,之前也是看了网上的很多资料。之所以使用jmxtrans+influxdb+grafana是因为界面酷炫,可以定制化,缺点是不能操作Kafka集群,可能需要配合Kafka Manager一起使用。
环境信息
CentOS Linux release 7.6.1810 (Core)
jdk1.8.0_201
zookeeper-3.4.14
kafka_2.11-2.2.0
开启Kafka JMX端口
JMX(Java Management Extensions,即Java管理扩展)是一个为应用程序、设备、系统等植入管理功能的框架。JMX可以跨越一系列异构操作系统平台、系统体系结构和网络传输协议,灵活的开发无缝集成的系统、网络和服务管理应用。Kafka做为一款Java应用,已经定义了丰富的性能指标,(可以参考Kafka监控指标),通过JMX可以轻松对其进行监控。
在${KAFKA_HOME}/bin/路径下修改kafka-run-class.sh脚本,第一行增加JMX_PORT=9999即可。
JMX_PORT=9999
重启Kafka
./bin/kafka-server-stop.sh
./bin/kafka-server-start.sh -daemon ./config/server.properties
重启后查看Kafka以及JMX端口状态
ps -ef | grep kafka
root 8273 1 99 02:32 pts/0 00:00:09 /opt/jdk1.8.0_201/bin/java -Xmx1G -Xms1G -server -XX:+UseG1GC -XX:MaxGCPauseMillis=20 ...... kafka.Kafka ./config/server.properties
netstat -anop | grep 9999
tcp6 0 0 :::9999 :::* LISTEN 8273/java off (0.00/0/0)
安装InfluxDB
InfluxDB是一个时间序列数据库,用于处理海量写入与负载查询。InfluxDB旨在用作涉及大量时间戳数据的任何用例(包括DevOps监控,应用程序指标,物联网传感器数据和实时分析)的后端存储。
下载InfluxDB rpm安装包
wget https://dl.influxdata.com/influxdb/releases/influxdb-1.7.5.x86_64.rpm
--2019-04-10 02:52:30-- https://dl.influxdata.com/influxdb/releases/influxdb-1.7.5.x86_64.rpm
Resolving dl.influxdata.com (dl.influxdata.com)... 54.192.151.21, 54.192.151.81, 54.192.151.87, ...
Connecting to dl.influxdata.com (dl.influxdata.com)|54.192.151.21|:443... connected.
HTTP request sent, awaiting response... 200 OK
Length: 46536692 (44M) [application/octet-stream]
Saving to: ‘influxdb-1.7.5.x86_64.rpm’
100%[================================================================================================================================================================================>] 46,536,692 440KB/s in 60s
2019-04-10 02:53:37 (756 KB/s) - ‘influxdb-1.7.5.x86_64.rpm’ saved [46536692/46536692]
安装rpm包
rpm -ivh influxdb-1.7.5.x86_64.rpm
Preparing... ################################# [100%]
Updating / installing...
1:influxdb-1.7.5-1 ################################# [100%]
Created symlink from /etc/systemd/system/influxd.service to /usr/lib/systemd/system/influxdb.service.
Created symlink from /etc/systemd/system/multi-user.target.wants/influxdb.service to /usr/lib/systemd/system/influxdb.service.
启动InfluxDB
service influxdb start
Redirecting to /bin/systemctl start influxdb.service
查看InfluxDB状态
ps -ef | grep influxdb
influxdb 8475 1 2 03:01 ? 00:00:00 /usr/bin/influxd -config /etc/influxdb/influxdb.conf
root 8486 7007 0 03:02 pts/0 00:00:00 grep --color=auto influxdb
service influxdb status
Redirecting to /bin/systemctl status influxdb.service
● influxdb.service - InfluxDB is an open-source, distributed, time series database
Loaded: loaded (/usr/lib/systemd/system/influxdb.service; enabled; vendor preset: disabled)
Active: active (running) since Wed 2019-04-10 03:01:48 EDT; 22s ago
Docs: https://docs.influxdata.com/influxdb/
Main PID: 8475 (influxd)
CGroup: /system.slice/influxdb.service
└─8475 /usr/bin/influxd -config /etc/influxdb/influxdb.conf
Apr 10 03:01:48 node1 influxd[8475]: ts=2019-04-10T07:01:48.375804Z lvl=info msg="Starting precreation service" log_id=0EiWgWRl000 service=shard-precreation check_interval=10m advance_period=30m
Apr 10 03:01:48 node1 influxd[8475]: ts=2019-04-10T07:01:48.375810Z lvl=info msg="Starting snapshot service" log_id=0EiWgWRl000 service=snapshot
Apr 10 03:01:48 node1 influxd[8475]: ts=2019-04-10T07:01:48.375816Z lvl=info msg="Starting continuous query service" log_id=0EiWgWRl000 service=continuous_querier
Apr 10 03:01:48 node1 influxd[8475]: ts=2019-04-10T07:01:48.375826Z lvl=info msg="Starting HTTP service" log_id=0EiWgWRl000 service=httpd authentication=false
Apr 10 03:01:48 node1 influxd[8475]: ts=2019-04-10T07:01:48.375830Z lvl=info msg="opened HTTP access log" log_id=0EiWgWRl000 service=httpd path=stderr
Apr 10 03:01:48 node1 influxd[8475]: ts=2019-04-10T07:01:48.375936Z lvl=info msg="Listening on HTTP" log_id=0EiWgWRl000 service=httpd addr=[::]:8086 https=false
Apr 10 03:01:48 node1 influxd[8475]: ts=2019-04-10T07:01:48.375949Z lvl=info msg="Starting retention policy enforcement service" log_id=0EiWgWRl000 service=retention check_interval=30m
Apr 10 03:01:48 node1 influxd[8475]: ts=2019-04-10T07:01:48.376138Z lvl=info msg="Listening for signals" log_id=0EiWgWRl000
Apr 10 03:01:48 node1 influxd[8475]: ts=2019-04-10T07:01:48.376389Z lvl=info msg="Storing statistics" log_id=0EiWgWRl000 service=monitor db_instance=_internal db_rp=monitor interval=10s
Apr 10 03:01:48 node1 influxd[8475]: ts=2019-04-10T07:01:48.376534Z lvl=info msg="Sending usage statistics to usage.influxdata.com" log_id=0EiWgWRl000
使用InfluxDB客户端
influx
Connected to http://localhost:8086 version 1.7.5
InfluxDB shell version: 1.7.5
Enter an InfluxQL query
>
创建用户和数据库
> CREATE USER "admin" WITH PASSWORD 'admin' WITH ALL PRIVILEGES
> create database "jmxDB"
创建完成InfluxDB的用户和数据库暂时就够用了,其它简单操作如下,后面会用到
#创建数据库
create database "db_name"
#显示所有的数据库
show databases
#删除数据库
drop database "db_name"
#使用数据库
use db_name
#显示该数据库中所有的表
show measurements
#创建表,直接在插入数据的时候指定表名
insert test,host=127.0.0.1,monitor_name=test count=1
#删除表
drop measurement "measurement_name"
#退出
quit
安装jmxtrans
jmxtrans的作用是自动去jvm中获取所有jmx格式数据,并按照某种格式(json文件配置格式)输出到其他应用程序(本例中的influxDB)。
下载jmxtrans rpm安装包
wget http://central.maven.org/maven2/org/jmxtrans/jmxtrans/270/jmxtrans-270.rpm
--2019-04-10 03:18:14-- http://central.maven.org/maven2/org/jmxtrans/jmxtrans/270/jmxtrans-270.rpm
Resolving central.maven.org (central.maven.org)... 151.101.40.209
Connecting to central.maven.org (central.maven.org)|151.101.40.209|:80... connected.
HTTP request sent, awaiting response... 200 OK
Length: 18750744 (18M) [application/x-rpm]
Saving to: ‘jmxtrans-270.rpm’
100%[================================================================================================================================================================================>] 18,750,744 342KB/s in 43s
2019-04-10 03:18:59 (422 KB/s) - ‘jmxtrans-270.rpm’ saved [18750744/18750744]
安装rpm包
rpm -ivh jmxtrans-270.rpm
Preparing... ################################# [100%]
Updating / installing...
1:jmxtrans-270-1 ################################# [100%]
jmxtrans相关路径
jmxtrans安装目录:/usr/share/jmxtrans
json文件默认目录:/var/lib/jmxtrans/
日志路径:/var/log/jmxtrans/jmxtrans.log
配置json,jmxtrans的github上有一段示例配置
{
"servers" : [ {
"port" : "1099",
"host" : "w2",
"queries" : [ {
"obj" : "java.lang:type=Memory",
"attr" : [ "HeapMemoryUsage", "NonHeapMemoryUsage" ],
"resultAlias":"jvmMemory",
"outputWriters" : [ {
"@class" : "com.googlecode.jmxtrans.model.output.InfluxDbWriterFactory",
"url" : "http://127.0.0.1:8086/",
"username" : "admin",
"password" : "admin",
"database" : "jmxDB",
"tags" : {"application" : "kafka"}
} ]
} ]
} ]
}
host:监控服务器
port:jmx端口
obj:对应jmx的ObjectName,就是我们要监控的指标
attr:对应ObjectName的属性,可以理解为我们要监控的指标的值
resultAlias:对应metric 的名称,在InfluxDB里面就是MEASUREMENTS名
tags:对应InfluxDB的tag功能,对与存储在同一个MEASUREMENTS里面的不同监控指标可以做区分,我们在用Grafana绘图的时候会用到,建议对每个监控指标都打上tags
启动jmxtrans
service jmxtrans start
Starting JmxTrans...
查看日志没有报错即为成功
tail /var/log/jmxtrans/jmxtrans.log
INFO | jvm 1 | 2019/04/10 04:44:31 | Using thread pool 'org.quartz.simpl.SimpleThreadPool' - with 10 threads.
INFO | jvm 1 | 2019/04/10 04:44:31 | Using job-store 'org.quartz.simpl.RAMJobStore' - which does not support persistence. and is not clustered.
INFO | jvm 1 | 2019/04/10 04:44:31 |
INFO | jvm 1 | 2019/04/10 04:44:31 | 2019-04-10 04:44:31 [WrapperSimpleAppMain] INFO org.quartz.impl.StdSchedulerFactory - Quartz scheduler 'ServerScheduler' initialized from an externally opened InputStream.
INFO | jvm 1 | 2019/04/10 04:44:31 | 2019-04-10 04:44:31 [WrapperSimpleAppMain] INFO org.quartz.impl.StdSchedulerFactory - Quartz scheduler version: 1.8.6
INFO | jvm 1 | 2019/04/10 04:44:31 | 2019-04-10 04:44:31 [WrapperSimpleAppMain] INFO org.quartz.core.QuartzScheduler - JobFactory set to: com.googlecode.jmxtrans.guice.GuiceJobFactory@23822296
2019-04-10 04:44:31 [WrapperSimpleAppMain] level com.googlecode.jmxtrans.JmxTransformer [JmxTransformer.java:177] - Starting Jmxtrans on : /var/lib/jmxtrans
2019-04-10 04:44:31 [WrapperSimpleAppMain] level org.quartz.core.QuartzScheduler [QuartzScheduler.java:519] - Scheduler ServerScheduler_$_node11554885871753 started.
INFO | jvm 1 | 2019/04/10 04:44:31 | 2019-04-10 04:44:31 [WrapperSimpleAppMain] INFO c.googlecode.jmxtrans.JmxTransformer - Starting Jmxtrans on : /var/lib/jmxtrans
INFO | jvm 1 | 2019/04/10 04:44:31 | 2019-04-10 04:44:31 [WrapperSimpleAppMain] INFO org.quartz.core.QuartzScheduler - Scheduler ServerScheduler_$_node11554885871753 started.
附上两段通用的json文件
base_127.0.0.1.json
View Code
topicA_1.json
View Code
安装Grafana
Grafana是一个跨平台的开源的度量分析和可视化工具,可以通过将采集的数据查询然后可视化的展示,并及时通知。
下载jmxtrans rpm安装包
wget https://s3-us-west-2.amazonaws.com/grafana-releases/release/grafana-6.0.2-1.x86_64.rpm
--2019-04-10 04:53:15-- https://s3-us-west-2.amazonaws.com/grafana-releases/release/grafana-6.0.2-1.x86_64.rpm
Resolving s3-us-west-2.amazonaws.com (s3-us-west-2.amazonaws.com)... 52.218.144.92
Connecting to s3-us-west-2.amazonaws.com (s3-us-west-2.amazonaws.com)|52.218.144.92|:443... connected.
HTTP request sent, awaiting response... 200 OK
Length: 56002012 (53M) [application/x-RedHat-package-manager]
Saving to: ‘grafana-6.0.2-1.x86_64.rpm’
100%[================================================================================================================================================================================>] 56,002,012 177KB/s in 2m 52s
2019-04-10 04:56:08 (318 KB/s) - ‘grafana-6.0.2-1.x86_64.rpm’ saved [56002012/56002012]
安装rpm包
rpm -ivh grafana-6.0.2-1.x86_64.rpm
warning: grafana-6.0.2-1.x86_64.rpm: Header V4 RSA/SHA1 Signature, key ID 24098cb6: NOKEY
error: Failed dependencies:
fontconfig is needed by grafana-6.0.2-1.x86_64
urw-fonts is needed by grafana-6.0.2-1.x86_64
缺少依赖,下载依赖
yum install --downloadonly --downloaddir=./ fontconfig
yum localinstall fontconfig-2.13.0-4.3.el7.x86_64.rpm
yum install --downloadonly --downloaddir=./ urw-fonts
yum localinstall urw-fonts-2.4-16.el7.noarch.rpm
rpm -ivh grafana-6.0.2-1.x86_64.rpm
warning: grafana-6.0.2-1.x86_64.rpm: Header V4 RSA/SHA1 Signature, key ID 24098cb6: NOKEY
Preparing... ################################# [100%]
Updating / installing...
1:grafana-6.0.2-1 ################################# [100%]
### NOT starting on installation, please execute the following statements to configure grafana to start automatically using systemd
sudo /bin/systemctl daemon-reload
sudo /bin/systemctl enable grafana-server.service
### You can start grafana-server by executing
sudo /bin/systemctl start grafana-server.service
POSTTRANS: Running script
启动Grafana
service grafana-server start
Starting grafana-server (via systemctl): [ OK ]
打开浏览器
http://127.0.0.1:3000

先输入默认用户名密码admin/admin

设置新密码
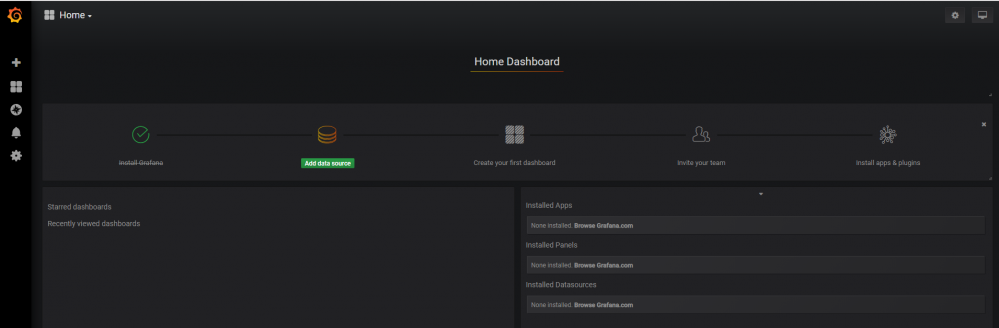
点击Add data source
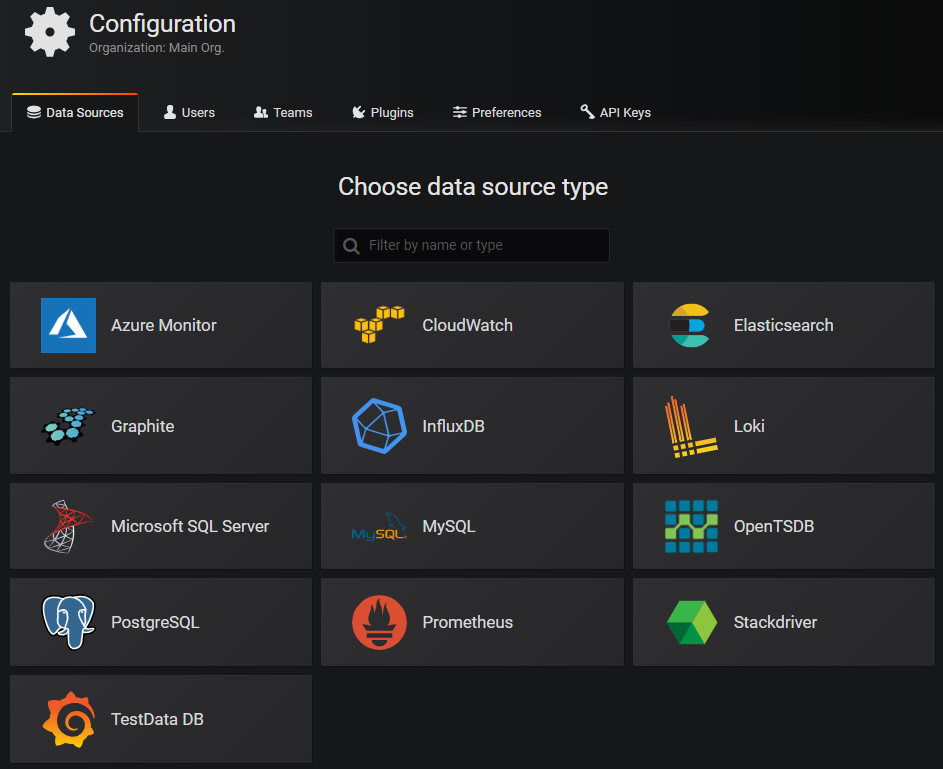
选择InfluxDB
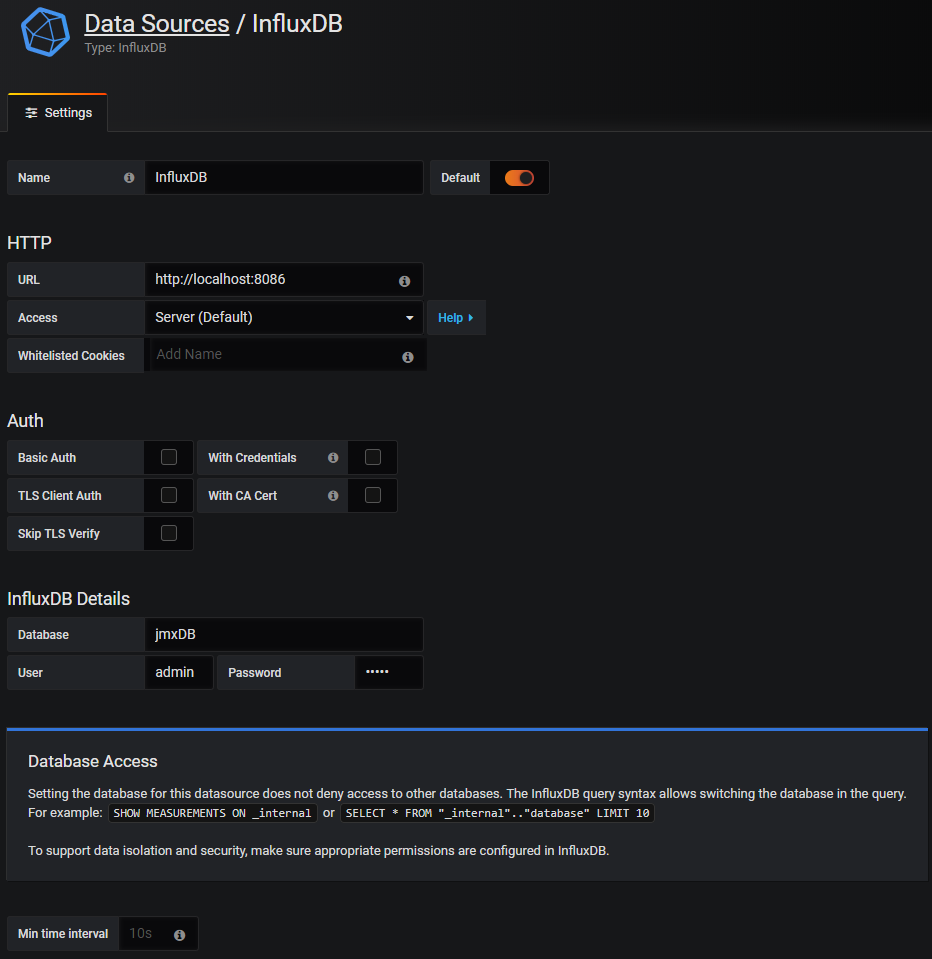
输入连接信息后点击Save & Test

通过后点击Back返回
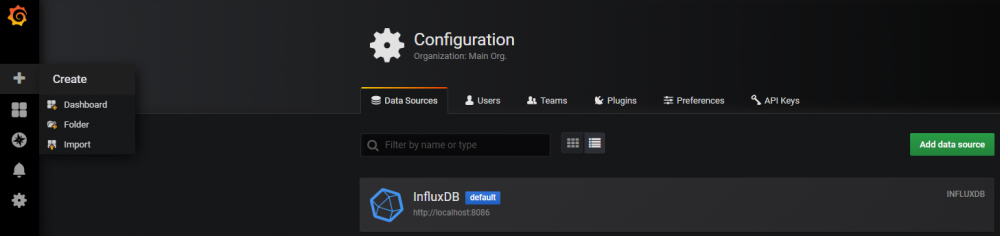
左侧 + 可以创建或引入仪表盘
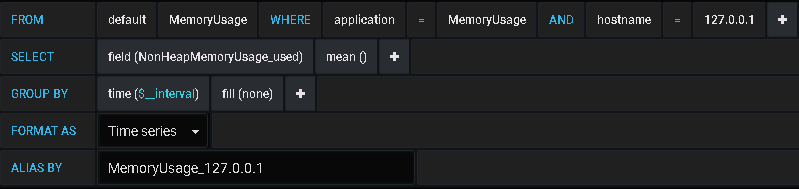
类似于数据库SQL语句,查询相应的指标
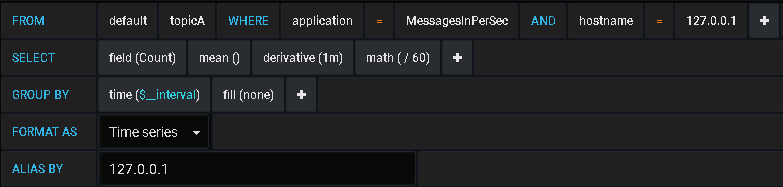
计算平均每秒数值可以使用如上语法,用当前值减1分钟之前的值再除以60
具体展示效果就看各位的审美能力,这里就不贴出来了。至此,Kafka的JMX指标监控就完成了。
Linux公社的RSS地址 : https://www.linuxidc.com/rssFeed.aspx
本文永久更新链接地址: https://www.linuxidc.com/Linux/2019-04/158037.htm
正文到此结束
- 本文标签: tag linux rpm git 集群 数据 json dist Quartz Service stream 定制 ip cat UI App Amazon 下载 物联网 Statement 协议 shell 数据库 配置 CTO 开源 Word Persistence JVM 服务器 maven grep 安装 TCP 开发 删除 RAMJobStore Thread pool root db tar sql 时间 操作系统 http JobFactory id wget node zookeeper GitHub dependencies core Jobs java 端口 js apr Google list src StdSchedulerFactory IO 2019 目录 tab https centos 管理 key lib Job ORM
- 版权声明: 本文为互联网转载文章,出处已在文章中说明(部分除外)。如果侵权,请联系本站长删除,谢谢。
- 本文海报: 生成海报一 生成海报二
热门推荐


相关文章


Loading...
![[HBLOG]公众号](http://www.liuhaihua.cn/img/qrcode_gzh.jpg)

