那些绕不过去的 Java 知识点
Checks for unguarded accesses to fields and methods with @GuardedBy annotations
@GuardedBy("obj")
private ConcurrentMap<String, String> map = new ConcurrentHashMap<>();
private final Object obj = new Object();

public void put(String k, String v) {
    synchronized (obj) {
        map.put(k, v);
    }
}

/**
 * If you use `error prone` tool to check this, this annotation should be `@SuppressWarnings("GuardedBy")`
 * {@see https://errorprone.info/bugpattern/GuardedBy}
 * {@see https://github.com/apache/incubator-druid/pull/6868#discussion_r249639199}
 */
@SuppressWarnings("FieldAccessNotGuarded")
public void remove(String k) {
    map.remove(k);
}

@Override
public String toString() {
    synchronized (obj) {
        return "GuardedByExample{" +
                "map=" + map +
                '}';
    }
}
Tips: Code Example
Tips: There are a couple more annotations called @GuardedBy , including javax.annotation.concurrent.GuardedBy and org.checkerframework.checker.lock.qual.GuardedBy . The check recognizes those versions of the annotation, but we recommend using com.google.errorprone.annotations.concurrent.GuardedBy .
InterfaceStability
-
@InterfaceStability.Stable
主版本是稳定的,不同主版本间,可能不兼容
-
@InterfaceStability.Evolving
不断变化中,不同的次版本间,可能不兼容
-
@InterfaceStability.Unstable
不对可靠性和健壮性做任何保证
InterfaceAudience
-
@InterfaceAudience.Public
对所有工程可用
-
@InterfaceAudience.LimitedPrivate
仅限特性的工程,如HBase、 Zookeeper 、HDFS 等(以 Hadoop 为例)
-
@InterfaceAudience.Private
仅限于 Hadoop 本工程内部使用(以 Hadoop 为例)
序列化
transient
给实现了 Serializable 接口的类中的字段,增加 transient 修饰符,则可以让该字段跳过序列化的过程
Tips: Full code is here and here .
类中包含没有实现 Serializable 接口的字段
需要自己实现 serialize 和 deserialize 方法
Tips: Full code is here and here .
实用技巧
Collection 内元素类型转换
// 对集合里面的元素类型进行转换(A -> B)
List<B> variable = (List<B>)(List<?>) collectionOfListA;
集合的差集、交集、并集
// 使用 Guava 中封装的 Sets 类
import com.google.common.collect.Sets;

Sets.difference(set1, set2)
Sets.intersection(set1, set2)
Sets.union(set1, set2)
数组转为 Set
// JDK8
new HashSet<>(Arrays.asList(str.trim().split(",")))
// JDK9+
Set.of(str.trim().split(","));
TransmittableThreadLocal 解决跨父子线程和线程池缓存问题
编码
String tlMsg = "tl";
String ttlMsg = "ttl";

final ThreadLocal<String> tl = new ThreadLocal<>();
tl.set(tlMsg);
final TransmittableThreadLocal<String> ttl = new TransmittableThreadLocal<>();
ttl.set(ttlMsg);

assertEquals(tl.get(), tlMsg);
assertEquals(ttl.get(), ttlMsg);

new Thread(() -> {
    assertNull(tl.get());
    assertEquals(ttl.get(), ttlMsg);
}).start();
Tips: Full code is here .
参考
- TransmittableThreadLocal 详解
- ThreadLocal 父子线程传递实现方案
- ThreadLocal 源码分析解密
- yuzhouwan / transmittable-thread-local
可读性
魔法数字
编码过程中,应该避免没有声明含义的纯数字出现
反面示例
// org.apache.kafka.connect.runtime.distributed.DistributedHerder#stop
@Override
public void stop() {
  if (!forwardRequestExecutor.awaitTermination(10000L, TimeUnit.MILLISECONDS))
    forwardRequestExecutor.shutdownNow();
}
正面示例
// 这里除了需要将 10000L 抽象成 FORWARD_REQUEST_SHUTDOWN_TIMEOUT_MS 静态变量
// 还可以进一步使用 10_000L 方便阅读
// 因为这里和时间有关,更进一步,可以使用 TimeUnit.SECONDS.toMillis(10) 来代替纯数字
private static final long FORWARD_REQUEST_SHUTDOWN_TIMEOUT_MS = TimeUnit.SECONDS.toMillis(10);

@Override
public void stop() {
  if (!forwardRequestExecutor.awaitTermination(FORWARD_REQUEST_SHUTDOWN_TIMEOUT_MS, TimeUnit.MILLISECONDS))
    forwardRequestExecutor.shutdownNow();
}
Tips: Full code is here .
字符串判空
反面示例
// org.apache.kafka.connect.runtime.distributed.DistributedHerder#reconfigureConnector
leaderUrl.equals("")
正面示例
// 一方面,需要考虑不能将对象放在 equals 方法之前,避免空指针异常
// 另一方面,使用 `str.length() == 0` 的方式,效率会高一些
// 进一步,使用 isEmpty() 方法,则可以使得代码更加可读
leaderUrl == null || leaderUrl.trim().isEmpty()
Tips: Full code is here .
箭头型代码
反面示例
public void m(String s) {
	if (s != null) {
		if (s.trim().length() > 0) {
			if (s.contains("yuzhouwan")) {
				System.out.println("https://yuzhouwan.com");
			}
		}
	}
}
正面示例
public void m(String s) {
	if (s == null) {
		return;
	}
	if (s.trim().length() == 0) {
		return;
	}
	if (!s.contains("yuzhouwan")) {
		return;
	}
	System.out.println("https://yuzhouwan.com");
}
参考
- 如何重构“箭头型”代码
函数式编程
反面示例
public Long deserialize(ByteArrayDataInput in) {
    return isNullByteSet(in) ? null : in.readLong();
}
正面示例
return Optional.ofNullable(in)
               .filter(InputRowSerde::isNotNullByteSet)
               .map(ByteArrayDataInput::readLong)
               .get();
参考
- Write null byte when indexing numeric dimensions with Hadoop #7020
设计模式
里氏替换原则
描述
里氏替换原则( L iskov s ubstitution p rinciple, LSP )强调的是 面向对象程序设计中的 可替代性 ,说明在计算机程序中,如果 S 是 T 的子类型,那么类型 T 的对象可以用类型 S 的对象替换(即 T 类型的对象可以被任何子类型 S 的对象替换),而不改变程序的任何期望属性(正确地执行的任务等)
参考
- baike.baidu: 里氏替换原则
- wikipedia: Liskov substitution principle
- 面向对象设计原则(三):里氏替换原则(LSP)
性能优化
工具层面
性能指标监控
<metrics.version>3.2.0</metrics.version>

<dependency>
  <groupId>io.dropwizard.metrics</groupId>
    <artifactId>metrics-core</artifactId>
  <version>${metrics.version}</version>
  <exclusions>
    <exclusion>
      <groupId>org.slf4j</groupId>
      <artifactId>slf4j-api</artifactId>
    </exclusion>
  </exclusions>
</dependency>
JMH 基准测试
增加Maven 依赖
<jmh.version>1.19</jmh.version>

<!-- JMH -->
<dependency>
    <groupId>org.openjdk.jmh</groupId>
    <artifactId>jmh-core</artifactId>
    <version>${jmh.version}</version>
</dependency>
<dependency>
    <groupId>org.openjdk.jmh</groupId>
    <artifactId>jmh-generator-annprocess</artifactId>
    <version>${jmh.version}</version>
</dependency>
编写 JMH 测试案例
import org.openjdk.jmh.annotations.*;
import org.openjdk.jmh.runner.Runner;
import org.openjdk.jmh.runner.RunnerException;
import org.openjdk.jmh.runner.options.Options;
import org.openjdk.jmh.runner.options.OptionsBuilder;

import java.util.concurrent.TimeUnit;

@BenchmarkMode(Mode.Throughput)
@OutputTimeUnit(TimeUnit.MILLISECONDS)
@State(Scope.Thread)
public class BenchmarkSimple {

    @Benchmark
    public void bench() {
        add(1, 1);
    }

    private static int add(int a, int b) {
        return a + b;
    }

    /*
    Benchmark               Mode    Cnt     Score        Error     Units
    BenchmarkSimple.bench   thrpt    5  13352311.603 ± 767137.272  ops/ms
     */
    public static void main(String[] args) throws RunnerException {
        Options opt = new OptionsBuilder()
                .include(BenchmarkSimple.class.getSimpleName())
                .forks(1)
                .warmupIterations(5)
                .measurementIterations(5)
                .threads(10)
                .build();
        new Runner(opt).run();
    }
}
Tips: Full code is here .
优势
- 不和会 JUnit 冲突,不用担心 Jenkins 会自动跑 Benchmark 测试而影响效率(否则需要添加
@Ignore让 CI 系统忽略掉性能相关的 JUnit 测试用例) - 支持
warm up,可以解决 JIT 预热 问题
BTrace
介绍
BTrace is a safe, dynamic tracing tool for the Java platform.
BTrace can be used to dynamically trace a running Java program (similar to DTrace for OpenSolaris applications and OS). BTrace dynamically instruments the classes of the target application to inject tracing code (“bytecode tracing”).
参考
- BTrace - a safe, dynamic tracing tool for the Java platform
LooseJar
介绍
分析没有被加载任何 class 的 jar 包,帮助删除工程中不必要的 jar 包
Tips: 不过需要注意的是,有些类是动态加载的(比如数据类型转换类的,只有加载数据时才会用到),需要尽可能地多测试,才能保证 loosejar 分析准确
使用步骤
-
下载
在 loosejar 的 release 页面 ,下载 loosejar-1.1.0.jar
-
拷贝
将 loosejar.jar 放到应用的 WEB-INF 下的 lib 目录中,比如说路径是
E:/core_code/yuzhouwan/yuzhouwan-site/yuzhouwan-site-web/src/main/webapp/WEB-INF/lib/loosejar.jar -
配置
在 IDE 中的 installed JRES 里面的 JDK 处配置
-Dfile.encoding=uft8 -javaagent:E:/core_code/yuzhouwan/yuzhouwan-site/yuzhouwan-site-web/src/main/webapp/WEB-INF/lib/loosejar.jar -
启动
启动应用,尽可能做到路径全覆盖地测试应用,让每段代码都被执行到
-
查看结果
运行 JDK 自带的 jconsole 工具,选择 bootstrap 的那个端口,然后选择 MBean 下的
com.googlecode.loosejar,并点击 summary,即可看到分析结果
参考
- 使用 loosejar.jar 清理 java 工程中多余的 jar 包
编码层面
并发相关
synchronized
详见,《 如何运用 JVM 知识提高编程水平 》
StampedLock
特性
该类是一个读写锁的改进,它的思想是读写锁中读不仅不阻塞读,同时也不应该阻塞写
参考
- Java 8 新特性探究(十)StampedLock 将是解决同步问题的新宠
- Java 8 对读写锁的改进:StampedLock
集合优化
HashMap
为什么 Java 8 版本中引入红黑树
-
原因
JDK 1.8 以前 HashMap 的实现是 数组+链表 ,即使哈希函数取得再好,也很难达到元素百分百均匀分布
当 HashMap 中有大量的元素都存放到同一个桶中时,这个桶下有一条长长的链表,这个时候 HashMap 就相当于一个单链表,假如单链表有 n 个元素,遍历的时间复杂度就是 $O(n)$,完全失去了它的优势
针对这种情况,JDK 1.8 中引入了 红黑树 (查找时间复杂度为 $O(/log n)$)来优化这个问题
-
具体操作
添加时,当桶中链表个数 超过 8 时会转换成红黑树
删除、扩容时,如果桶中结构为红黑树,并且树中元素个数太少的话,会进行修剪或者直接还原成链表结构
查找时即使哈希函数设计不合理,大量元素集中在一个桶中,由于有红黑树结构,性能也不会差
Collections 类
空集合
Collections.emptyList() reuses an object instead of creating a new object as it will be the case with Arrays.asList() .
Collections.singletonList(something) is immutable whereas Arrays.asList(something) is a fixed size List representation of an Array where the List and Array gets joined in the heap.
参考
- Empty list: What is the difference between Arrays.asList() and Collections.emptyList()?
-
Arrays.asList()vsCollections.singletonList()
LinkedList vs. ArrayList
LinkedList
-
get(int index)is $O(n/4)$ average -
add(E element)is $O(1)$ -
add(int index, E element)is $O(n/4)$ averagebut $O(1)$ when
index = 0<—- main benefit ofLinkedList<E> -
remove(int index)is $O(n/4)$ average -
Iterator.remove()is $O(1)$ <—- main benefit ofLinkedList<E> -
ListIterator.add(E element)is $O(1)$ <—- main benefit ofLinkedList<E>
Note: $O(n/4)$ is average, $O(1)$ best case (e.g. index = 0), $O(n/2)$ worst case (middle of list)
ArrayList
-
get(int index)is $O(1)$ <—- main benefit ofArrayList<E> -
add(E element)is $O(1)$ amortized, but $O(n)$ worst-case since the array must be resized and copied -
add(int index, E element)is $O(n/2)$ average -
remove(int index)is $O(n/2)$ average -
Iterator.remove()is $O(n/2)$ average -
ListIterator.add(E element)is $O(n/2)$ average
参考
- When to use LinkedList over ArrayList ?
- JDK Docs: LinkedList / ArrayList
contains 方法
HashSet
时间复杂度 和 内存使用率 角度看, HashSet 为最佳之选
参考
- Java Collection Performance
toArray 方法
说明
Call to ‘toArray()’ with pre-sized array argument ‘new Repository[remoteRepositories.size()]’ less… (Ctrl+F1)
There are two styles to convert a collection to an array: either using a pre-sized array (like c.toArray(new String[c.size()])) or using an empty array (like c.toArray(new String[0]).
In older Java versions using pre-sized array was recommended, as the reflection call which is necessary to create an array of proper size was quite slow. However since late updates of OpenJDK 6 this call was intrinsified, making the performance of the empty array version the same and sometimes even better, compared to the pre-sized version. Also passing pre-sized array is dangerous for a concurrent or synchronized collection as a data race is possible between the size and toArray call which may result in extra nulls at the end of the array, if the collection was concurrently shrunk during the operation.
This inspection allows to follow the uniform style: either using an empty array (which is recommended in modern Java) or using a pre-sized array (which might be faster in older Java versions or non-HotSpot based JVMs).
压测
@State(Scope.Thread)
@OutputTimeUnit(TimeUnit.NANOSECONDS)
@BenchmarkMode(Mode.AverageTime)
public class ToArrayBenchmark {

    @Param({"1", "100", "1000", "5000", "10000", "100000"})
    private int n;

    private final List<Object> list = new ArrayList<>();

    @Setup
    public void populateList() {
        for (int i = 0; i < n; i++) {
            list.add(0);
        }
    }

    @Benchmark
    public Object[] preSize() {
        return list.toArray(new Object[n]);
    }

    @Benchmark
    public Object[] resize() {
        return list.toArray(new Object[0]);
    }

    /*
    Integer List:
    Benchmark                    (n)  Mode  Cnt       Score        Error  Units
    ToArrayBenchmark.preSize       1  avgt    3      41.552 ±    108.030  ns/op
    ToArrayBenchmark.preSize     100  avgt    3     216.449 ±    799.501  ns/op
    ToArrayBenchmark.preSize    1000  avgt    3    2087.965 ±   6027.778  ns/op
    ToArrayBenchmark.preSize    5000  avgt    3    9098.358 ±  14603.493  ns/op
    ToArrayBenchmark.preSize   10000  avgt    3   24204.199 ± 121468.232  ns/op
    ToArrayBenchmark.preSize  100000  avgt    3  188183.618 ± 369455.090  ns/op
    ToArrayBenchmark.resize        1  avgt    3      18.987 ±     36.449  ns/op
    ToArrayBenchmark.resize      100  avgt    3     265.549 ±   1125.008  ns/op
    ToArrayBenchmark.resize     1000  avgt    3    1560.713 ±   2922.186  ns/op
    ToArrayBenchmark.resize     5000  avgt    3    7804.810 ±   8333.390  ns/op
    ToArrayBenchmark.resize    10000  avgt    3   24791.026 ±  78459.936  ns/op
    ToArrayBenchmark.resize   100000  avgt    3  158891.642 ±  56055.895  ns/op

    Object List:
    Benchmark                    (n)  Mode  Cnt      Score       Error  Units
    ToArrayBenchmark.preSize       1  avgt    3     36.306 ±    96.612  ns/op
    ToArrayBenchmark.preSize     100  avgt    3     52.372 ±    84.159  ns/op
    ToArrayBenchmark.preSize    1000  avgt    3    449.807 ±   215.692  ns/op
    ToArrayBenchmark.preSize    5000  avgt    3   2080.172 ±  2003.726  ns/op
    ToArrayBenchmark.preSize   10000  avgt    3   4657.937 ±  8432.624  ns/op
    ToArrayBenchmark.preSize  100000  avgt    3  51980.829 ± 46920.314  ns/op
    ToArrayBenchmark.resize        1  avgt    3     16.747 ±    85.131  ns/op
    ToArrayBenchmark.resize      100  avgt    3     43.803 ±    28.704  ns/op
    ToArrayBenchmark.resize     1000  avgt    3    404.681 ±   132.986  ns/op
    ToArrayBenchmark.resize     5000  avgt    3   1972.649 ±   174.691  ns/op
    ToArrayBenchmark.resize    10000  avgt    3   4021.440 ±  1114.212  ns/op
    ToArrayBenchmark.resize   100000  avgt    3  44204.167 ± 76714.850  ns/op
     */
    public static void main(String[] args) throws Exception {
        Options opt = new OptionsBuilder()
                .include(ToArrayBenchmark.class.getSimpleName())
                .forks(1)
                .warmupIterations(1)
                .measurementIterations(3)
                .threads(1)
                .build();
        new Runner(opt).run();
    }
}
Tips: Full code is here .
instanceof
| Operation | Runtime in nanoseconds per operation | Relative to instanceof |
|---|---|---|
| INSTANCEOF | 39,598 ± 0,022 ns/op | 100,00 % |
| GETCLASS | 39,687 ± 0,021 ns/op | 100,22 % |
| TYPE | 46,295 ± 0,026 ns/op | 116,91 % |
| OO | 48,078 ± 0,026 ns/op | 121,42 % |
参考
- The performance impact of using instanceof in Java
字符串相关
repeat
借鉴 JDK11 中新增的 String#repeat 特性,实现高效的 repeat 工具方法
import java.nio.charset.StandardCharsets;

/**
 * Returns a string whose value is the concatenation of the
 * string {@code str} repeated {@code count} times.
 * <p>
 * If count or length is zero then the empty string is returned.
 * <p>
 * This method may be used to create space padding for
 * formatting text or zero padding for formatting numbers.
 *
 * @param count number of times to repeat
 * @return A string composed of this string repeated
 * {@code count} times or the empty string if count
 * or length is zero.
 * @throws IllegalArgumentException if the {@code count} is negative.
 * @link https://bugs.openjdk.java.net/browse/JDK-8197594
 */
public static String repeat(String s, int count) {
    if (count < 0) {
        throw new IllegalArgumentException("count is negative, " + count);
    }
    if (count == 1) {
        return s;
    }
    byte[] value = s.getBytes(StandardCharsets.UTF_8);
    final int len = value.length;
    if (len == 0 || count == 0) {
        return "";
    }
    if (len == 1) {
        final byte[] single = new byte[count];
        Arrays.fill(single, value[0]);
        return new String(single, StandardCharsets.UTF_8);
    }
    if (Integer.MAX_VALUE / count < len) {
        throw new OutOfMemoryError();
    }
    final int limit = len * count;
    final byte[] multiple = new byte[limit];
    System.arraycopy(value, 0, multiple, 0, len);
    int copied = len;
    for (; copied < limit - copied; copied <<= 1) {
        System.arraycopy(multiple, 0, multiple, copied, copied);
    }
    System.arraycopy(multiple, 0, multiple, copied, limit - copied);
    return new String(multiple, StandardCharsets.UTF_8);
}
参考
- Simple way to repeat a String in java
- JDK-8197594: String#repeat
Fork / Join 思想
参考
- Java Fork Join 框架
- Move Caching Cluster Client to java streams and allow parallel intermediate merges #5913
堆栈优化
ByteBuffer
使用 allocateDirect(int capacity) 不使用堆栈,而是通过 OS 创建内存块作为缓冲区。可以与当前操作系统更好地耦合,因此能进一步提高 I/O 操作速度。缺点是,分配直接缓冲区的系统开销很大。因此,只有在缓冲区较大并会长期存在,或者需要经常重用时,才使用这种缓冲区
位运算
参考
- 在写代码的过程中使用位运算的好处?
- 只用位运算实现比较两整数大小,有没有简短优雅的
O(1)的解法? - Bytes.java
- ByteBuffer 常用方法详解
- 优秀程序员不得不知道的 20 个位运算技巧
- Java 移位操作符你真的懂吗?
日志相关
log4j 开启 BufferedIO
参考
- Log4j BufferedIO 与 flush BufferedIO
测试相关
参数驱动
利用 @Parameterized.Parameters 注解可以指定多个可能的传值,使得当前测试类下的所有测试用例可以被多次复用。但是该注解并不能让参数之间自行组合,所以严格来说,并不是参数驱动(后续介绍的 HttpRunner 框架则是严格意义上的参数驱动)
import com.yuzhouwan.compression.CompressionType;
import org.junit.FixMethodOrder;
import org.junit.Test;
import org.junit.runner.RunWith;
import org.junit.runners.MethodSorters;
import org.junit.runners.Parameterized;

import java.util.Arrays;

@FixMethodOrder(MethodSorters.JVM)
@RunWith(Parameterized.class)
public class CompressionTest {

    @Parameterized.Parameter()
    public CompressionType compressionType4ts;
    @Parameterized.Parameter(1)
    public CompressionType compressionType4longValue;
    @Parameterized.Parameter(2)
    public CompressionType compressionType4doubleValue;

    @Parameterized.Parameters
    public static Iterable<Object[]> getParameters() {
        return Arrays.asList(new Object[][]{
                {CompressionType.NONE, CompressionType.NONE, CompressionType.NONE},
                {CompressionType.SIMPLE8B, CompressionType.NONE, CompressionType.GORILLA},
                {CompressionType.SIMPLE8B_WITH_RLE, CompressionType.ZIGZAG_WITH_SIMPLE8B, CompressionType.NONE},
        });
    }

    /**
     * NONE - NONE - NONE
     * SIMPLE8B - NONE - GORILLA
     * SIMPLE8B_WITH_RLE - ZIGZAG_WITH_SIMPLE8B - NONE
     */
    @Test
    public void test() {
        System.out.println(compressionType4ts + " - " + compressionType4longValue + " - " + compressionType4doubleValue);
    }
}
测试先行
参考
- TDD(测试驱动开发)
- TDD(测试驱动开发)是否已死?
自动生成 Test Case
参考
- randoop / randoop
- thx / RAP
自动化测试
HttpRunner
介绍
HttpRunner 是一款面向 HTTP(S) 协议的通用测试框架,只需编写维护一份 YAML/JSON 脚本,即可实现自动化测试、性能测试、线上监控、持续集成等多种测试需求。这里将以测试 OpenTSDB 为例,更加具象地介绍 HttpRunner
QuickStart
安装
$ pip install httprunner==1.5.15

$ hrun -V
  1.5.15

$ har2case -V
  0.2.0
启动 Flask
$ pip install flask

$ mkdir docs/data/
$ wget https://cn.httprunner.org/data/api_server.py -P docs/data/
$ export FLASK_APP=docs/data/api_server.py
$ export FLASK_ENV=development
$ flask run

$ curl localhost:5000
  Hello World!
测试
$ wget https://cn.httprunner.org/data/demo-quickstart.har -P docs/data/

# 将 demo-quickstart.har 转换为 HttpRunner 的测试用例文件
# 默认输出 JSON 文件,加 `-2y` 参数,可以转化为 YAML
$ har2case docs/data/demo-quickstart.har
$ hrun docs/data/demo-quickstart.json
新建测试项目
# 新建目录
$ httprunner --startproject yuzhouwan

$ ls -sail
  12891420763 4 -rw-r--r--  1 benedictjin wheel   44 Feb  2 11:37 .env
  12891384628 0 drwxr-xr-x  2 benedictjin wheel   64 Feb  1 16:44 api/
  12891454305 4 -rw-r--r--  1 benedictjin wheel 2389 Feb  2 14:34 debugtalk.py
  12891454901 4 -rw-r--r--  1 benedictjin wheel 1452 Feb  2 15:21 locustfile.py
  12891454386 0 drwxr-xr-x  8 benedictjin wheel  256 Feb  2 15:30 reports/
  12891384629 0 drwxr-xr-x  7 benedictjin wheel  224 Feb  2 14:47 testcases/
  12891384630 0 drwxr-xr-x  2 benedictjin wheel   64 Feb  1 16:44 testsuites/
# .env         存放环境变量的 properties 文件
# testcases    存放所有 httprunner 的 json 测试实例
# debugtalk.py 存放所有 httprunner 测试实例中,需要用到自定义函数
# reports      生成的 html 结果页面
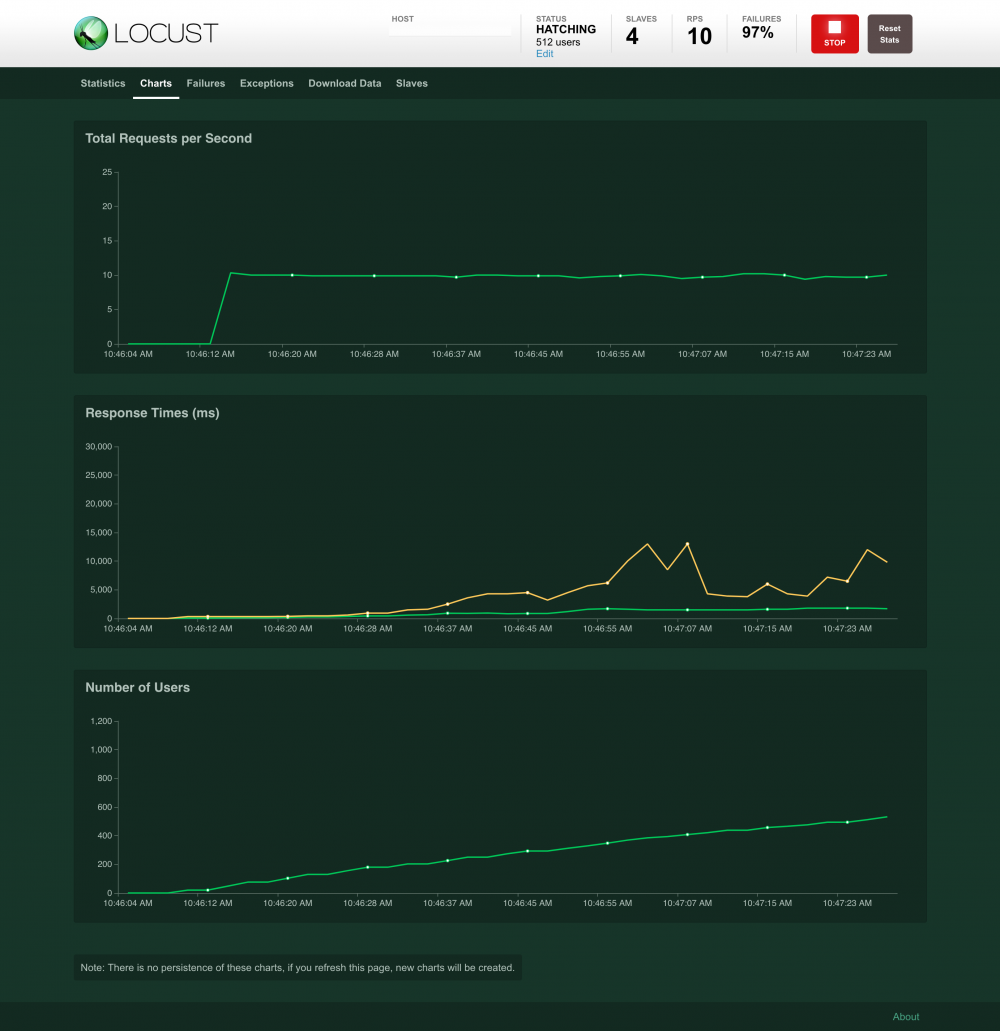
性能测试
环境部署
$ python -m pip install --trusted-host pypi.python.org --trusted-host files.pythonhosted.org --trusted-host pypi.org locustio

$ locusts -V
  [2019-02-02 10:17:55,387] BenedictJin.local/INFO/stdout: Locust 0.9.0
  [2019-02-02 10:17:55,387] BenedictJin.local/INFO/stdout:

$ locusts -f put_one_point_with_variable_data_types.json --processes 4
  [2019-02-02 10:18:53,668] BenedictJin.local/INFO/locust.main: Starting web monitor at *:8089
  [2019-02-02 10:18:53,668] BenedictJin.local/INFO/locust.main: Starting Locust 0.9.0
测试限流
# 需要先打开服务端的限流
$ source .env
$ locusts -f testcases/limit/limit_tps_with_number.json --processes 4 -H ${base_url_from_env} -L DEBUG
$ locusts -f testcases/limit/limit_tps_with_string.json --processes 4 -H ${base_url_from_env} -L DEBUG
可视化管理系统
部署
按照 部署手册 即可部署成功。相关的,比如, MySQL 安装 、 RabbitMQ 安装 ,都能找到很多资料。这里,主要记录几个可能踩到的坑
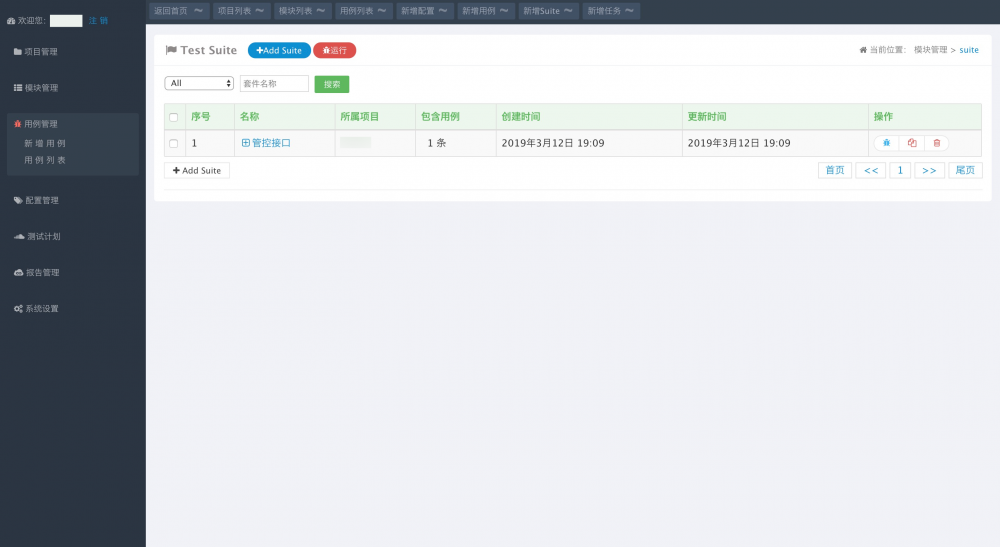
可视化管理页面
配置环境、增加测试用例、组合测试套件等, 效果 如下图所示:
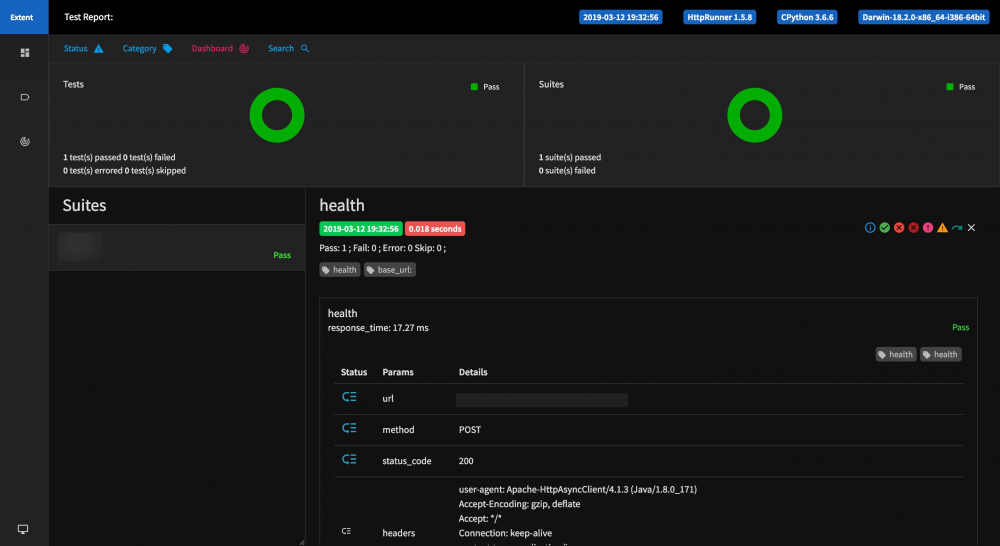
运行结果报告页面, 效果 如下图所示:
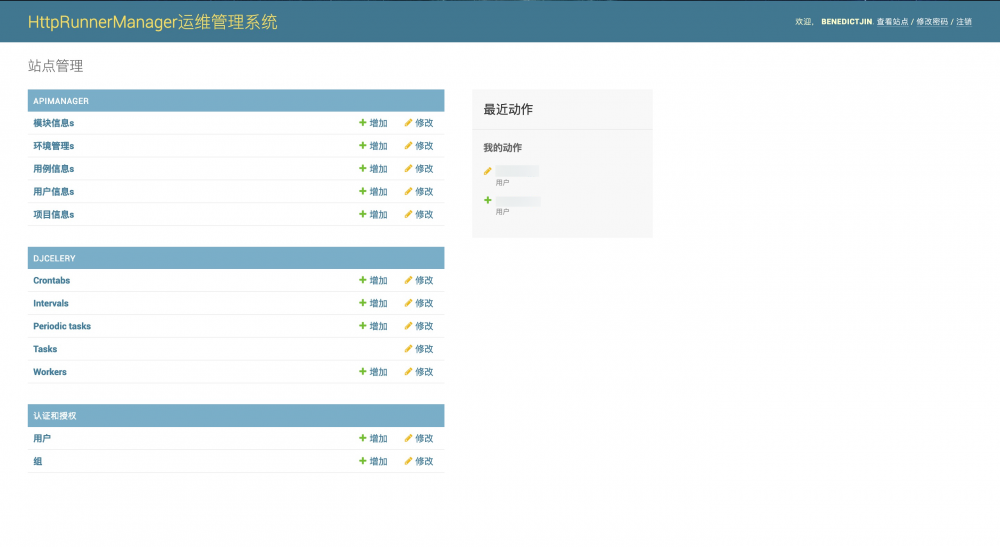
支持权限管理,超级管理员可以配置整个管理系统, 效果 如下图所示:
踩到的坑
-
编码相关
-
描述
$ python manage.py migrate
# 报错 django.db.utils.OperationalError: (1366, "Incorrect string value for column 'name' at row 1")
-
解决
这个问题是因为新安装的 MySQL 默认的编码不是
UTF-8导致的,停掉mysql实例配置my.cnf再重启即可。如果停止不掉,可以pkill mysql强制停止。之前创建的数据库也需要删掉重新创建$ cd /usr/local/mysql/support-files $ sudo ./mysql.server stop $ vim my.cnf [client] default-character-set=utf8 [mysql] default-character-set=utf8 [mysqld] collation-server=utf8_unicode_ci init-connect='SET NAMES utf8' character-set-server=utf8 # 如果 my.cnf 没有生效,可能需要拷贝一份到 /private/etc 目录下 $ cd /private/etc $ sudo cp /usr/local/mysql/support-files/my.cnf . $ sudo ./mysql.server restart $ mysql -u root -p mysql> show variables like '%char%'; +--------------------------+-----------------------------------------------------------+ | Variable_name | Value | +--------------------------+-----------------------------------------------------------+ | character_set_client | utf8 | | character_set_connection | utf8 | | character_set_database | utf8 | | character_set_filesystem | binary | | character_set_results | utf8 | | character_set_server | utf8 | | character_set_system | utf8 | | character_sets_dir | /usr/local/mysql-5.7.25-macos10.14-x86_64/share/charsets/ | +--------------------------+-----------------------------------------------------------+ 8 rows in set (0.00 sec) mysql> drop database HttpRunner; Query OK, 27 rows affected (0.05 sec) mysql> create database HttpRunner; Query OK, 1 row affected (0.00 sec) # 增加 `TEST_CHARSET` 连接配置 $ vim HttpRunnerManager/settings.py DATABASES = { 'default': { # ... 'TEST_CHARSET': 'utf-8' } } $ python manage.py migrate
-
抓包并转为 TestCase
使用 Charles 抓包工具
通过该方法,可以将现有的测试用例,轻松地转为 http_runner 的表现形式
- 安装 Charles Proxy
# Mac
# https://www.charlesproxy.com/download/

# Linux
$ cat <<EOF > /etc/yum.repos.d/Charles.repo
  [charlesproxy]
  name=Charles Proxy Repository
  baseurl=https://www.charlesproxy.com/packages/yum
  gpgkey=https://www.charlesproxy.com/packages/yum/PublicKey
  EOF

$ sudo yum install charles-proxy
- 关闭 browsermob-proxy
$ pkill -1 -f browsermob-proxy
- 在 Http Request 中增加 proxy
request.setConfig(RequestConfig.custom().setProxy(new HttpHost("127.0.0.1", 8888)).build());
// 修改好之后,重新打包编译即可
使用 browsermobproxy 代理库
也可以通过编写 Python 脚本,来创建 Proxy,并使用 Json 库将 Proxy 抓包内容以 har 的形式保存为文件
import json
import os
import time

import psutil
from browsermobproxy import Server

# pkill -1 -f browsermob-proxy
for proc in psutil.process_iter():
    if proc.name() == "browsermob-proxy":
        proc.kill()

server = Server(path="/apps/browsermob-proxy-2.1.4/bin/browsermob-proxy",
                options={'port': 8880})
server.start()

time.sleep(1)
proxy = server.create_proxy(params={'port': 8881})
time.sleep(1)

with open('testcases.txt', "r+", encoding="utf8") as of:
    os.chdir("/code/yuzhouwan-test-cloud")
    for line in of.readlines():

        line = line.strip('/n')
        print(line)
        if '.' not in line:
            continue
        splits = line.split('.')
        clazz = splits[0]
        method = splits[1]
        proxy.new_har("com.yuzhouwan.yuzhouwan.client.%s,%s" % (clazz, method),
                      options={'captureHeaders': True, 'captureContent': True, 'captureBinaryContent': True})

        command = 'java -ea -Didea.test.cyclic.buffer.size=1048576 -javaagent:' /
                  '<...>" ' /
                  'com.intellij.rt.execution.junit.JUnitStarter -ideVersion5 -junit4 ' /
                  'com.yuzhouwan.yuzhouwan.client.%s,%s' % (clazz, method)
        os.system(command)

        json_obj = json.dumps(proxy.har)

        file_dir = '/Users/benedictjin/Documents/http_runner/%s/' % clazz
        file_name = method
        file_extension = '.har'
        if not os.path.exists(file_dir):
            os.makedirs(file_dir)

        fileObject = open(file_dir + file_name + file_extension, 'w')
        fileObject.write(json_obj)
        fileObject.close()

server.stop()
二次开发
解决 http_runner 中只能解析部分 parameters 的问题
# vim httprunner/parser.py
parsed_parameters_list = []
for parameter in parameters:
    parameter_name, parameter_content = list(parameter.items())[0]
    parameter_name_list = parameter_name.split("-")


# 改为
parsed_parameters_list = []
for parameter_name, parameter_content in parameters.items():
    parameter_name_list = parameter_name.split("-")
使得 har2case 支持 list 结构的 JSON
详见:Let _make_validate method supports the list structures JSON #18
使得 har2case 支持普通文本的返回类型
# vim har2case/core.py
mime_type = resp_content_dict.get("mimeType")
if mime_type and mime_type.startswith("application/json"):

    encoding = resp_content_dict.get("encoding")
    if encoding and encoding == "base64":
        content = base64.b64decode(text).decode('utf-8')
        try:
            resp_content_json = json.loads(content)
        except JSONDecodeError:
            logging.warning("response content can not be loaded as json.")
            return
    else:
        resp_content_json = json.loads(text)

# 改为
mime_type = resp_content_dict.get("mimeType")
if mime_type and mime_type.startswith("application/json"):

    encoding = resp_content_dict.get("encoding")
    if encoding and encoding == "base64":
        text = base64.b64decode(text).decode('utf-8')
    try:
        resp_content_json = json.loads(text)
    except JSONDecodeError:
        logging.warning("response content can not be loaded as json.")
        return
    print("resp_content_json", resp_content_json)
使二次开发的改动生效
$ pip uninstall har2case -y
$ cd /usr/local/har2case/har2case
$ python setup.py install

$ har2case --log-level DEBUG test.har
资料
Doc
- HttpRunner V2.x 中文使用文档
- BrowserMob Proxy’s documentation
Github
- HttpRunner / HttpRunner
- Let
_make_validatemethod supports theliststructures JSON #18
Blog
- DebugTalk:探索一个软件工程师的无限可能
- selenium.common.exceptions.SessionNotCreatedException: Message: Unable to find a matching set of capabilities with Firefox 46 through Selenium
- httprunner 中 validate 的比较方法总结
- Mac 下 MySQL 5.7.19 字符编码设置为 utf-8 的方法
JVM 相关
基本概念
堆内 vs. 堆外
堆内内存
一般情况下,Java 中分配的非空对象都是由 Java 虚拟机的垃圾收集器管理的,也称为 堆内内存 (on-heap memory)
堆外内存
堆外内存(off-heap memory)意味着把内存对象分配在 Java 虚拟机的堆以外的内存,这些内存直接受操作系统管理(而不是虚拟机)
堆外内存的优势
- 对于大内存有良好的伸缩性
- 对垃圾回收停顿的改善可以明显感觉到
- 在进程间可以共享,减少虚拟机间的复制
堆外内存的劣势
- 数据结构变得不那么直观,发生内存溢出的时候,排查定位会很麻烦
- 如果数据结构比较复杂,就要对它进行串行化(serialization),而串行化本身也会影响性能
- 可以使用更大的内存的同时,需要担心虚拟内存(即硬盘)的速度对应用的影响
示例
/*
-XX:MaxDirectMemorySize=64M 可以控制堆外内存大小,默认在 VM 静态变量 directMemory 为 64M

maxDirectMemory: 67108864
isDirect: true
 */
public static void main(String[] args) throws InterruptedException {
    System.out.println("maxDirectMemory: " + VM.maxDirectMemory());
    ByteBuffer buffer = ByteBuffer.allocateDirect(1024 * 1024 * 64);
    Thread.sleep(200);
    boolean isDirect = buffer.isDirect();
    System.out.println("isDirect: " + isDirect);
    if (isDirect) ((DirectBuffer) buffer).cleaner().clean();
    else buffer.clear();
    Thread.sleep(200);
    System.exit(0);
}
参考
- 从 0 到 1 起步 - 跟我进入堆外内存的奇妙世界
- 堆外内存(off-heap)、堆内内存(on-heap)
- Java 堆外内存之突破 JVM 枷锁
- 堆内内存还是堆外内存?
指针压缩
定义
64 位环境下, 寄存器是 64 位的,对应指针也就成 64 位了,也就是 8 字节。我们知道 4 字节可以表示 4G,实际中基本不会有需要加载这么多对象的情况。因此 8 字节就显得浪费了,narrowKlass 只使用 4 个字节,预分配给 _metadata 的 8 字节中的另外 4 字节就可以用做它用了。看似 4 个字节无关紧要,但是堆中存在上千万到亿个对象时,省下的内存就是几百兆啊
流程
基于以下事实
- CPU 使用的虚拟地址是 64 位的,访问内存时,必须使用 64 位的指针访问内存对象
- Java 对象是分配于具体的某个内存位置的,对其访问必须使用 64 位地址
- 对 Java 对象内的引用字段进行访问时, 必须经过虚拟机这一层, 操作某个对象引用不管是 getfield 还是 putfield,都是由虚拟机来执行。或者简单来说,要改变 Java 对象某个引用字段, 必须经过虚拟机的参与
细心的你从上面一定可以看出一点线索,由于存一个对象引用和取一个对象引用必须经过虚拟机,所以完全可以在虚拟机这一层做些手脚。对于外部来说,putfield 提供的对象地址是 64 位的,经过虚拟机的转换,映射到 32 位,然后存入对象;getfield 指定目标对象的 64 位地址和其内部引用字段的偏移,取 32 位的数据,然后反映射到 64 位内存地址。对于外部来说,只看见 64 位的对象放进去,拿出来,内部的转换是透明的(本质上,就是按字节寻址,变成了 按字寻址 )
原理
描述
CompressedOops 的原理是,解释器在解释字节码时,植入压缩指令(不影响正常和 JVM 优化后的指令顺序)
具体逻辑是,当对象被读取时,解压,存入 heap 时,压缩
压缩指令伪码
! int R8; oop[] R9; // R9 is 64 bits
! oop R10 = R9[R8]; // R10 is 32 bits
! load compressed ptr from wide base ptr:
movl R10, [R9 + R8<<3 + 16]
! klassOop R11 = R10._klass; // R11 is 32 bits
! void* const R12 = GetHeapBase();
! load compressed klass ptr from compressed base ptr:
movl R11, [R12 + R10<<3 + 8]
零基压缩优化 (Zero Based Compressd Oops)
零基压缩是针对压解压动作的进一步优化。它通过改变正常指针的随机地址分配特性,强制从零开始做分配(需要 OS 支持),进一步提高了压解压效率
要启用零基压缩,你分配给 JVM 的内存大小必须控制在 4G 以上,32G 以下
如果小于 4G,那么 JVM 会使用低虚拟地址空间(low virutal address space,64 位下模拟 32 位),这样就不需要做压解压动作了
而对于大于 32G,将采用默认的随机地址分配特性,进行压解压
适用场景
CompressedOops,可以让跑在 64 位平台下的 JVM,不需要因为更宽的寻址,而付出 Heap 容量损失的代价。
不过,它的实现方式是在机器码中植入压缩与解压指令,可能会给 JVM 增加额外的开销
参数控制
-XX:+UseCompressedOops 开启( jdk1.6.0_14+ )
-XX:-UseCompressedOops 关闭
零基压缩的 边界
$ JAVA_HOME=`/usr/libexec/java_home -v 1.8` java -Xmx32766m -XX:+PrintFlagsFinal 2> /dev/null | grep UseCompressedOops
  bool UseCompressedOops   := true

$ JAVA_HOME=`/usr/libexec/java_home -v 1.8` java -Xmx32767m -XX:+PrintFlagsFinal 2> /dev/null | grep UseCompressedOops
  bool UseCompressedOops   = false

# 如果已经 JVM 进程已经启动了,可以通过 jinfo 进行查询
$ jinfo -flag UseCompressedOops 18979
  -XX:-UseCompressedOops
压缩 class 信息中的指针
从 JDK6_u23 开始 UseCompressedOops 被默认打开了。因此既能享受 64bit 带来的好处,又避免了 64bit 带来的性能损耗。当然,如果你有机会使用超过 32G 的堆内存,记得把这个选项关了
到了 Java8,永久代被干掉了,有了 “meta space” 的概念,存储 JVM 中的元数据,包括 Byte code,class 等信息。Java8 在 UseCompressedOops 之外,额外增加了一个新选项叫做 UseCompressedClassPointer。这个选项打开后,class 信息中的指针也用 32bit 的 Compressed 版本。而这些指针指向的空间被称作 “Compressed Class Space”。默认大小是 1G,但可以通过 “CompressedClassSpaceSize” 调整
如果你的 Java 程序引用了太多的包,有可能会造成这个空间不够用,于是会看到
java.lang.OutOfMemoryError: Compressed class space
这时,一般调大 CompreseedClassSpaceSize 就可以了
常用 Collector
CMS
定义
CMS,全称 C oncurrent M ark S weep,是一款并发的、使用 标记-清除 算法的垃圾回收器
内存碎片
CMS 本身是不会移动内存的,长时间运行后,会产生很多内存碎片,导致没有一段足够大的连续区域可以存放大对象,导致 promotion failed 、 concurrent mode failure 等异常,从而触发 Full GC
启用 -XX:+UseCMSCompactAtFullCollection 参数之后,会在 Full GC 的时候,对年老代的内存进行压缩。再配合 -XX:CMSFullGCsBeforeCompaction=0 参数可以控制多少次 FGC 后对老年代做压缩操作。默认值为 0,代表每次都压缩。该参数开启后,会把对象移动到内存的最左边,可能会影响性能,但是可以消除碎片
浮动垃圾
由于 CMS 并发清理阶段用户线程还在运行着,伴随程序运行自然就还会有新的垃圾不断产生,这一部分垃圾出现在标记过程之后,CMS 无法在当次收集中处理掉它们,只好留待下一次 GC 时再清理掉。这些无法被 GC 掉,留到下一次 GC 的垃圾,称之为 浮动垃圾
G1GC
- JAVA 虚拟机之四:G1 垃圾收集器
- Java Hotspot G1 GC 的一些关键技术
- 初探 Java 10 之 G1 收集器并行 Full GC
C4
- JVM 性能优化,Part 4:C4 垃圾回收
Shenandoah
- JEP 189: Shenandoah: An Ultra-Low-Pause-Time Garbage Collector
ZGC
- The Z Garbage Collector
常用参数
默认配置
-Xss 堆栈大小
| Platform | Default(KB) |
|---|---|
| Windows IA32 | 64 |
| Linux IA32 | 128 |
| Windows x86_64 | 128 |
| Linux x86_64 | 256 |
| Windows IA64 | 320 |
| Linux IA64 | 1024 |
| Solaris Sparc | 512 |
Tips: 实际案例 OpenTSDB 大查询导致 java.long.StackOverflowError 后,调整 -Xss32m 得以解决
日志方面
常用的配置项
| Flag | Comment |
|---|---|
| -verbose:gc | The -verbose:gc option enables logging of garbage collection (GC) information. |
| -XX:+PrintGCDetails -XX:+PrintGCTimeStamps | -XX:+PrintGCDetails and -XX:+PrintGCTimeStamps are used to print detailed information about garbage collection.(这里由于 -verbose:gc 相当于 -XX:+PrintGCDetails 的别名,避免冗余,应该去掉 -verbose:gc ) |
| -XX:-PrintTenuringDistribution | Print tenuring age information. |
| -XX:-UseGCLogFileRotation | Enabled GC log rotation, requires -Xloggc. |
| -XX:NumberOfGCLogFiles=3 | Set the number of files to use when rotating logs, must be >= 1. The rotated log files will use the following naming scheme, <filename> .0, <filename> .1, …, <filename> .n-1. |
| -XX:GCLogFileSize=8K | The size of the log file at which point the log will be rotated, must be >= 8K. |
实际效果
描述
以 Apache Druid 为例,在 Tranquility 组件启动时,加上 -XX:+PrintTenuringDistribution 参数后的效果如下:
$ nohup ./bin/tranquility -J-XX:+HeapDumpOnOutOfMemoryError -J-XX:HeapDumpPath=/data02/druid/ -J-verbose:gc -J-XX:+PrintGCDetails -J-XX:+PrintGCDateStamps -J-XX:+PrintGCDetails -J-XX:+PrintTenuringDistribution -J-Xloggc:/data02/druid/gc.log -Ddruid.extensions.directory=/home/druid/software/druid/extensions -Ddruid.extensions.loadList='["druid-avro-extensions"]' kafka -configFile conf/service/hbase_metrics_kafka2_avro.json > /home/druid/logs/tranquility/hbase_metrics_kafka2_avro.log 2>&1 &

# before
2017-03-23T14:38:23.582+0800: 90.288: [GC (Allocation Failure) [PSYoungGen: 9934821K->5622K(10469376K)] 12602986K->7093554K(28291584K), 0.6114898 secs] [Times: user=13.74 sys=0.06, real=0.61 secs]
2017-03-23T14:38:24.801+0800: 91.507: [GC (Allocation Failure) [PSYoungGen: 10071976K->3022K(10469376K)] 17159909K->8861529K(28291584K), 0.1748974 secs] [Times: user=3.91 sys=0.03, real=0.17 secs]
2017-03-23T14:38:26.178+0800: 92.884: [GC (Allocation Failure) [PSYoungGen: 10303201K->3733K(10469376K)] 19161707K->9746931K(28291584K), 0.1744318 secs] [Times: user=3.89 sys=0.02, real=0.17 secs]
2017-03-23T14:38:27.277+0800: 93.983: [GC (Allocation Failure) [PSYoungGen: 10091092K->902K(10469888K)] 19834290K->10628837K(28292096K), 0.1108355 secs] [Times: user=2.48 sys=0.01, real=0.12 secs]
2017-03-23T14:38:28.586+0800: 95.292: [GC (Allocation Failure) [PSYoungGen: 10089131K->1078K(10472448K)] 20717066K->11513094K(28294656K), 0.1054663 secs] [Times: user=2.34 sys=0.01, real=0.11 secs]
2017-03-23T14:38:29.840+0800: 96.546: [GC (Allocation Failure) [PSYoungGen: 10400114K->1501K(10461696K)] 21912131K->13281552K(28283904K), 0.1337201 secs] [Times: user=2.99 sys=0.01, real=0.13 secs]
2017-03-23T14:38:30.865+0800: 97.571: [GC (Allocation Failure) [PSYoungGen: 10133038K->1099K(10472448K)] 23413089K->15049201K(28294656K), 0.1312707 secs] [Times: user=2.94 sys=0.02, real=0.13 secs]
2017-03-23T14:38:30.996+0800: 97.702: [Full GC (Ergonomics) [PSYoungGen: 1099K->0K(10472448K)] [ParOldGen: 15048102K->1783009K(17664000K)] 15049201K->1783009K(28136448K), [Metaspace: 54341K->54341K(1095680K)], 0.3020992 secs] [Times: user=3.90 sys=0.00, real=0.31 secs]

# after
2017-03-23T14:41:03.576+0800: 31.699: [GC (Allocation Failure)
Desired survivor size 23592960 bytes, new threshold 1 (max 15)
[PSYoungGen: 9975727K->6112K(10454016K)] 13540045K->6222293K(27026432K), 0.2530233 secs] [Times: user=5.67 sys=0.03, real=0.25 secs]
2017-03-23T14:41:05.031+0800: 33.154: [GC (Allocation Failure)
Desired survivor size 23592960 bytes, new threshold 1 (max 15)
[PSYoungGen: 10241863K->11872K(10457088K)] 16458045K->8885401K(27029504K), 0.2811251 secs] [Times: user=6.27 sys=0.05, real=0.29 secs]
2017-03-23T14:41:06.022+0800: 34.145: [GC (Allocation Failure)
Desired survivor size 25165824 bytes, new threshold 1 (max 15)
[PSYoungGen: 10378567K->15664K(10458624K)] 19252097K->10661383K(27031040K), 0.2552984 secs] [Times: user=5.70 sys=0.05, real=0.25 secs]
2017-03-23T14:41:06.893+0800: 35.016: [GC (Allocation Failure)
Desired survivor size 24117248 bytes, new threshold 1 (max 15)
[PSYoungGen: 10054634K->10669K(10460160K)] 20700353K->12431545K(27032576K), 0.3152384 secs] [Times: user=6.89 sys=0.19, real=0.31 secs]
2017-03-23T14:41:07.208+0800: 35.331: [Full GC (Ergonomics) [PSYoungGen: 10669K->0K(10460160K)] [ParOldGen: 12420876K->1803376K(14484992K)] 12431545K->1803376K(24945152K), [Metaspace: 54185K->54185K(1095680K)], 0.2905749 secs] [Times: user=4.77 sys=0.00, real=0.29 secs]
参考
- Java HotSpot VM Options
- JVM 系列三:JVM 参数设置、分析
内存方面
-XX:+AlwaysPreTouch
描述
Pre-touch the Java heap during JVM initialization. Every page of the heap is thus demand-zeroed during initialization rather than incrementally during application execution.
参考
- 关于 XMS 和 XMX 参数问题求教
- virtualspace.cpp
- mutableSpace.cpp
启动 方面
-ea
# Usage:
  -enableassertions[:<packageName>"..." | :<className>]
  -ea[:<packageName>"..." | :<className>]

  该参数用来设置 jvm 是否启动断言机制(从 JDK 1.4 开始支持),默认 JVM 是关闭断言机制的,增加 `-ea` 参数可打开断言机制
  不指定 packageName 和 className 时运行所有包和类中的断言
  如果希望只运行某些包或类中的断言,可将包名或类名加到 `-ea` 之后
  比如想要启动包 `com.yuzhouwan.common` 下的断言机制,可用命令 `java -ea:com.yuzhouwan.common...<Main Class>`
实战技巧
查看 JVM 参数的默认值
# 查看 JDK8 中是否默认打开了 “对象头压缩” 开关
# 实际上,JDK6u23 版本之后,Hotspot 都已经打开了 -XX:+UseCompressedOops 功能(OOP,Ordinary Object Pointer)
$ java -XX:+PrintFlagsFinal -version | grep UseCompressedOops
       bool UseCompressedOops                        := true
            {lp64_product}
  java version "1.8.0_111"
  Java(TM) SE Runtime Environment (build 1.8.0_111-b14)
  Java HotSpot(TM) 64-Bit Server VM (build 25.111-b14, mixed mode)
查看 Java 进程的 JVM 参数
$ jcmd 666 VM.flags
  666:
  -XX:CICompilerCount=15 -XX:ConcGCThreads=6 -XX:G1HeapRegionSize=33554432 -XX:InitialHeapSize=197904039936 -XX:MarkStackSize=4194304 -XX:MaxGCPauseMillis=200 -XX:MaxHeapSize=197904039936 -XX:MaxNewSize=118715580416 -XX:MinHeapDeltaBytes=33554432 -XX:+PrintGC -XX:+PrintGCDateStamps -XX:+PrintGCDetails -XX:+PrintGCTimeStamps -XX:+UseFastUnorderedTimeStamps -XX:+UseG1GC
堆外内存分析
google-perftools
安装
# 先安装 g++
$ yum -y install gcc gcc-c++

# 安装 libunwind
$ wget http://download.savannah.gnu.org/releases/libunwind/libunwind-0.99.tar.gz
$ tar -xzvf libunwind-0.99.tar.gz
$ cd libunwind-0.99
$ ./configure --prefix=/data0/java/deploy/google-perftools/local/libunwind
$ make && make install

# 安装 gperftools
$ wget https://github.com/gperftools/gperftools/releases/download/gperftools-2.5/gperftools-2.5.tar.gz
$ tar -xzvf gperftools-2.5.tar.gz
$ cd gperftools-2.5
$ ./configure --prefix=/data0/java/deploy/google-perftools/local/gperftools-2.5/
$ make && make install

# 使配置生效
$ vim /etc/ld.so.conf.d/usr_local_lib.conf
  /data0/java/deploy/google-perftools/local/libunwind/lib

# 执行 ldconfig 命令,使libunwind生效。 需要 sudo 权限
$ /sbin/ldconfig

# 创建 tmp 目录
$ mkdir -p /data0/java/deploy/google-perftools/local/tmp

# 加入环境变量
# 不要加在 .bashrc 里面,放在 jvm 启动脚本里面即可
  export LD_PRELOAD=/data0/java/deploy/google-perftools/local/gperftools-2.5/lib/libtcmalloc.so
  export HEAPPROFILE=/data0/java/deploy/google-perftools/local/tmp/gzip

# 启动 jvm 进程,就会在 /data0/java/deploy/google-perftools/local/ 目录下生成 heap 文件
$ bin/hitsdb restart
分析
# 分析函数调用
$ /data0/java/deploy/google-perftools/local/gperftools-2.5/bin/pprof --text /usr/local/jdk1.8.0_181/bin/java /data0/java/deploy/google-perftools/local/tmp/gzip.0001.heap

  Using local file /usr/local/jdk1.8.0_181/bin/java.
  Using local file /data0/java/deploy/google-perftools/local/tmp/gzip.0001.heap.
  Total: 0.0 MB
       0.0  87.9%  87.9%      0.0 100.0% __FRAME_END__
       0.0   9.6%  97.5%      0.0   9.6% _nl_intern_locale_data
       0.0   1.2%  98.7%      0.0   1.2% __gconv_lookup_cache
       0.0   0.6%  99.3%      0.0   0.6% new_composite_name
       0.0   0.3%  99.6%      0.0  10.0% _nl_load_locale_from_archive
       0.0   0.2%  99.8%      0.0   0.2% __GI___strdup
       0.0   0.1%  99.9%      0.0   1.3% __wcsmbs_load_conv
       0.0   0.1% 100.0%      0.0   0.1% __bindtextdomain
       0.0   0.0% 100.0%      0.0  10.7% __GI_setlocale
       0.0   0.0% 100.0%      0.0   1.3% __btowc
       0.0   0.0% 100.0%      0.0   1.2% __gconv_find_transform
       0.0   0.0% 100.0%      0.0 100.0% __libc_start_main
       0.0   0.0% 100.0%      0.0   0.0% __textdomain
       0.0   0.0% 100.0%      0.0  10.0% _nl_find_locale
常用工具
JMC 监控报警工具(Java Mission Control)
JMC 工具是 JDK 里面自带的,只需要运行 jmc 命令即可
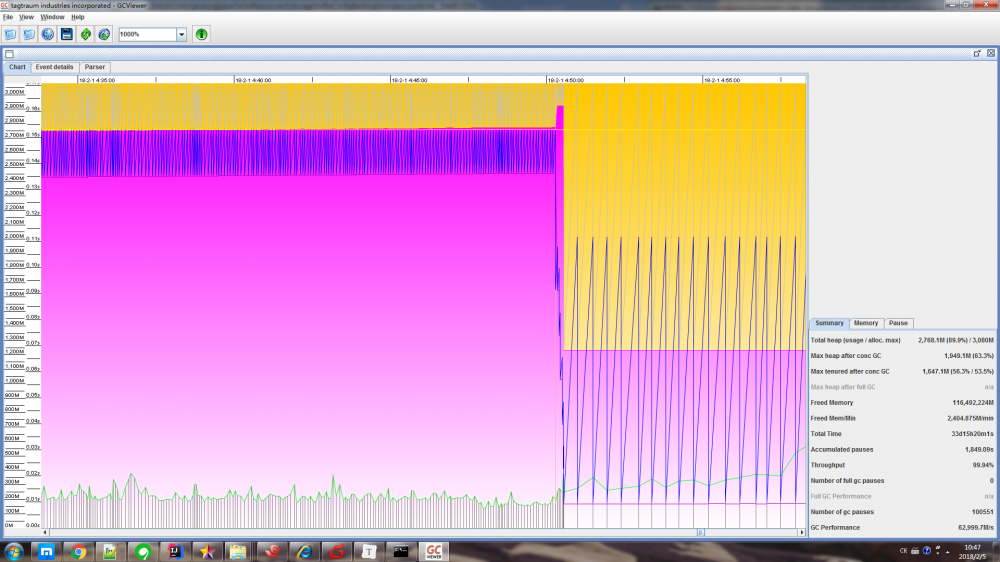
GCViewer
安装
在 GCViewer 的 下载页面 ,找到当前最新版本 gcviewer-1.35.jar 进行下载
使用
# 文件 yuzhouwan01.gc 是由增加了 `verbose:gc -XX:+PrintGCDetails -XX:+PrintGCDateStamps -Xloggc:/home/fm/logs/worker-gc.log` 参数的 JVM 进程生成的 GC 日志
$ java -jar gcviewer-1.35.jar yuzhouwan01.gc
效果图
参考
- 用 GCViewer 分析 GC 日志
MAT 内存分析工具(Memory Analyzer Tool)
创建 dump 文件
# 如果指定 live 参数的话,将会在 dump 之前,强制进行一次 Full GC
$ jmap -dump:[live,]format=b,file=<file_name>.hprof <pid>
火焰图
简介
火焰图 是一个二维图片,火焰图的 X 轴代表 采样总量 ,而 Y 轴代表 栈深度 。每个框就代表了一个栈里的函数,其宽度代表了所占用的 CPU 总时间 。因此,比较宽的框就表示,该函数运行时间较慢或被调用次数较多,从而占用的 CPU 时间多。通过火焰图,相关设计或分析人员就可以轻松观察到各个应用占用 CPU 的情况
Linux 平台上,对于多数 C/C++ 编写的应用,可以通过 perf 来方便的采样,还可以进一步生成火焰图来更直观地观察。Java 是没法直接用 perf 的。虽然有一个 perf-map-agent ,但是并不方便,尝试过程中还弄出了 kernel panic,所以这玩意是不敢在线上用了。不过 JDK 自己其实已经带了一个采样工具 FlightRecorder,算是 JMC 的一部分
以往获得火焰图所需要的复杂步骤
首先,应用启动的时候,要给 java 加上参数
-XX:+UnlockCommercialFeatures -XX:+FlightRecorder -XX:FlightRecorderOptions=loglevel=info
因为 JVM 默认在 safepoint 的地方才可以返回栈,所以最好加上下面两个参数,让 JVM 在非 safepoint 的时候也提供原数据
-XX:+UnlockDiagnosticVMOptions -XX:+DebugNonSafepoints
然后在准备开始采样的时候,使用下面命令,指定输出的文件路径,和采样时间
sudo -u <java_user> -i jcmd <pid> JFR.start filename=/tmp/app.jfr duration=60s
之后可以用 JFR.check 来检查采样是不是已经完成了(详见: Java Platform, Standard Edition Java Flight Recorder Runtime Guide )
sudo -u <java_user> -i jcmd <pid> JFR.check
确认完成后,就可以把 jfr 文件传回本地,用 jmc 来分析了。如果想要生成火焰图,还有这么个工具: jfr-flame-graph 。具体用法可以看文档。大致上,代码拖回来后就编译好了。另外还需要 FlameGraph
cd jfr-flame-graph
install-mc-jars.sh
mvn clean install -U
工具准备好以后,执行下面命令,就能生成一个漂亮的火焰图了
path/to/jfr-flame-graph/run.sh -f app.jfr -o app.txt
cat app.txt | path/to/FlameGraph/flamegraph.pl >app.svg
使用新版 JVM Profile 功能之后一键搞定
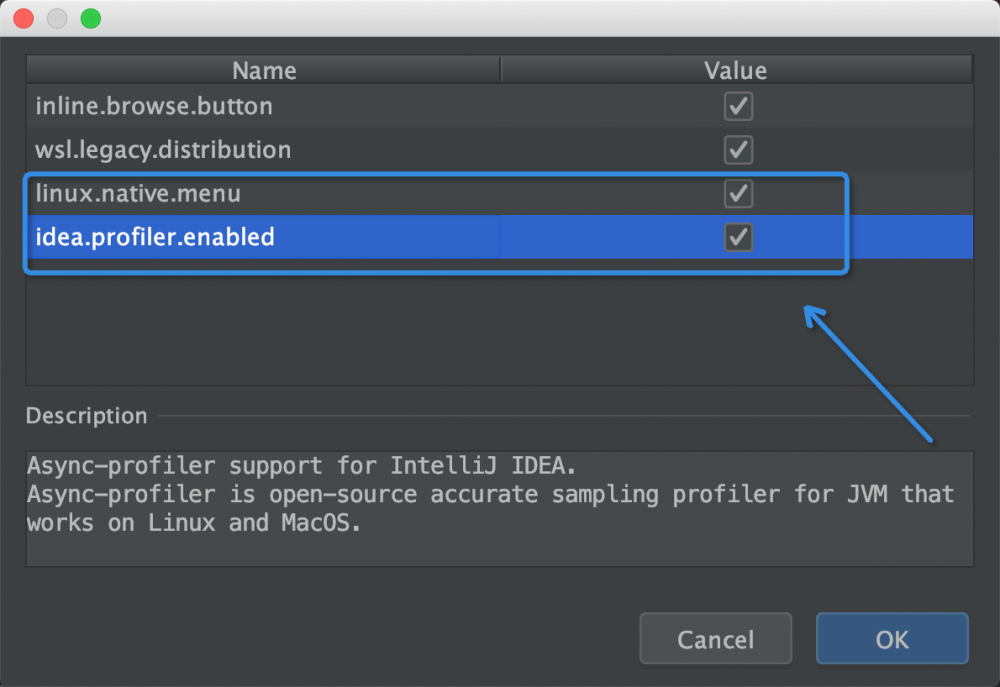
打开下载 Intellij Idea 下载页面,找到 Coming in 2018.3 ,然后下载 EAP 版本的 Intellij Idea

打开项目后,使用快捷键 ⌘⌥⇧/ 打开 Maintenance 面板,选择 Experimantal features ,勾选 linux.native.menu 和 idea.profiler.enabled
使用 Run xxx with Async Profiler 执行任意程序
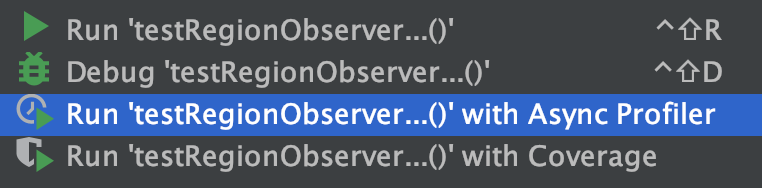
即可获得火焰图、方法调用链、方法列表
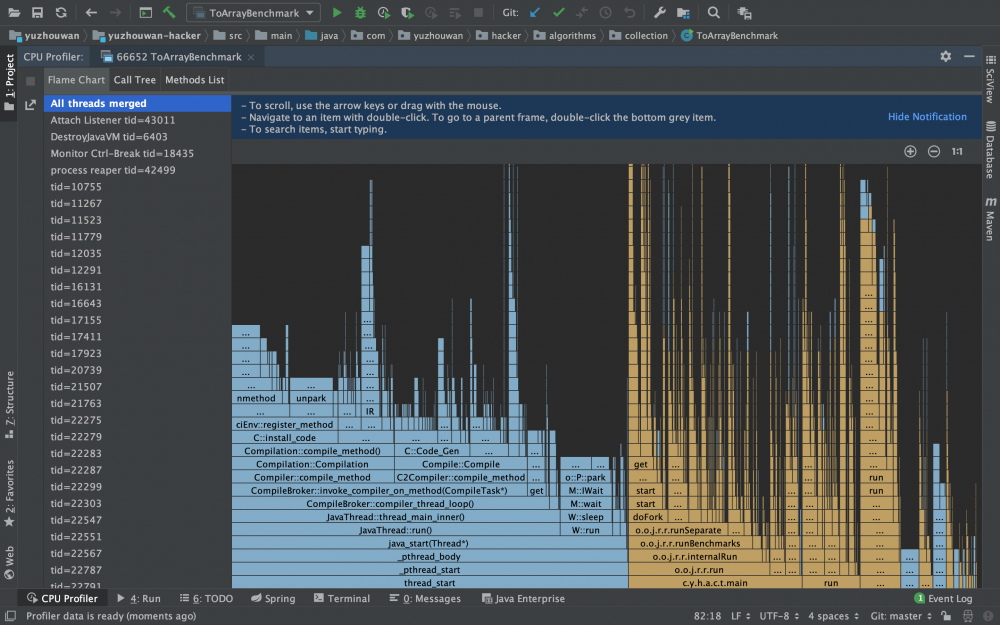
其中,
火焰图,主要用于分析 CPU 性能消耗。可以交互式地分析 JVM 进程中所有线程的 CPU 消耗火焰图,也可以选择某一个线程来分析;
方法调用链,可以找到在某个线程中,消耗 CPU 最多的方法
方法列表,可以看到每个方法的调用次数,展开后还可以看到详细的调用栈
Tips: Spark 任务生成火焰图
序列化 ID 排查工具
使用
serialver [ options ] [ classnames ]

  options
    The command-line options. See Options.

  classnames
    The classes for which the serialVersionUID is to be returned.
参考
- oracle wiki: serialver
- “Spark Streaming + Kafka direct + checkpoints + 代码改变” 引发的问题
常见问题
编码相关
SimpleDateFormat 多线程安全问题
分析
不安全的主要原因是,SimpleDateFormat 继承的 DateTime 类,本身就是不安全的。而根本原因是 DateTime 的类属性中 Calendar 实例,并没有使用同步代码块进行多线程安全处理。如果在执行 format(...) 方法的同时,有其他线程调用 setCalendar(Calendar newCalendar) 方法,则会出现混乱。处理的方法有很多,除了在每次需要使用重新初始化 SimpleDateFormat 实例,另外还可使用 ThreadLocal 对其进行缓存,再或者使用 Joda-time 替换 Jdk 原生的 SimpleDateFormat 和 Java 8 里面的 DateTimeFormatter(注意别触发 JDK-8031085 ,该问题在 JDK9 才修复),亦可
Tips: Full code is here and here .
参考
- How to format Joda-Time DateTime to only mm/dd/yyyy?
- 深入理解 Java:SimpleDateFormat 安全的时间格式化
- “Java DateFormat is not threadsafe” what does this leads to?
- Java 8 新增的 DateTimeFormatter 与 SimpleDateFormat 的区别
java.lang.IllegalThreadStateException
报错是因为 Thread 不可以使用 start() 启动多次,可以将逻辑放在 Runnable 对象中,每次启动的时候,再通过 new Thread(runnable).start() 初始化一个 Thread 对象来启动即可
取消数值的科学计数法
// 数值过大后,double、long 的 toString 可能会出现科学计数法
// 可以通过 NumberFormat 来解决
NumberFormat nf = NumberFormat.getInstance();
nf.setGroupingUsed(false);
nf.setMaximumFractionDigits(0);
nf.setMaximumIntegerDigits(64);

assertEquals("1234567890123456789", nf.format(1234567890123456789L));
assertEquals(1234567890123456789L, Long.valueOf(nf.format(1234567890123456789L)).longValue());
// 或者转换 double 的字符串为 long
assertEquals(0L, Long.valueOf(nf.format(0.0)).longValue());

nf.setMaximumFractionDigits(64);
assertEquals("0.12345678901234568", nf.format(0.1234567890_12345678D));
assertEquals(0.12345678901234568D, Double.valueOf(nf.format(0.1234567890_12345678D)), 64);
File#toURL 过期
使用 file.toURI().toURL() 替代
Jersey 的 @Produces 默认不设置 UTF-8 存在中文乱码
方案
实现 ContainerResponseFilter 接口,给 @Produces 注解增加 charset=UTF-8 属性
实现
编码 MediaTypeFilter
import com.sun.jersey.core.util.Priority;
import com.sun.jersey.spi.container.*;

import javax.ws.rs.Priorities;
import javax.ws.rs.Produces;
import javax.ws.rs.core.MediaType;
import javax.ws.rs.ext.Provider;
import java.lang.annotation.Annotation;

@Provider
@Priority(Priorities.HEADER_DECORATOR)
public class MediaTypeFilter implements ResourceFilter, ContainerResponseFilter {

    @Override
    public ContainerResponse filter(ContainerRequest request, ContainerResponse response) {
        Annotation[] annotations = response.getAnnotations();
        for (int i = 0; i < annotations.length; i++) {
            if (!(annotations[i] instanceof Produces)) {
                continue;
            }
            Produces produces = (Produces) annotations[i];
            String[] producesValues = produces.value();
            for (int j = 0; j < producesValues.length; j++) {
                if (!MediaType.APPLICATION_JSON.equals(producesValues[j]) && !MediaType.TEXT_PLAIN.equals(producesValues[j])) {
                    continue;
                }
                producesValues[j] += ";charset=UTF-8";
            }
            annotations[i] = produces;
        }
        response.setAnnotations(annotations);
        return response;
    }

    @Override
    public ContainerRequestFilter getRequestFilter() {
        return null;
    }

    @Override
    public ContainerResponseFilter getResponseFilter() {
        return this;
    }
}
在 BrokerResource 中使用
import com.google.common.collect.ImmutableMap;
import com.google.inject.Inject;
import com.sun.jersey.spi.container.ResourceFilters;
import org.apache.druid.client.BrokerServerView;
import org.apache.druid.server.http.security.StateResourceFilter;

import javax.ws.rs.GET;
import javax.ws.rs.Path;
import javax.ws.rs.Produces;
import javax.ws.rs.core.MediaType;
import javax.ws.rs.core.Response;

@Path("/druid/broker/v1")
@ResourceFilters({StateResourceFilter.class, MediaTypeFilter.class})
public class BrokerResource
{
  private final BrokerServerView brokerServerView;

  @Inject
  public BrokerResource(BrokerServerView brokerServerView)
  {
    this.brokerServerView = brokerServerView;
  }

  @GET
  @Path("/loadstatus")
  @Produces(MediaType.APPLICATION_JSON)
  public Response getLoadStatus()
  {
    return Response.ok(ImmutableMap.of("inventoryInitialized", brokerServerView.isInitialized())).build();
  }
}
参考
- Change what @Produces(…) produces in Jersey?
- Setting Character Set for Jersey Web Services
- add charset UTF-8 to log api #6709
IDE 相关
[Intellij Idea] Code Check 中设置行长度为 120,却仍然有一条虚线竖在 80
依次选择菜单 Settings - Editor - Code Style - Java ,这时候可以将默认的 Scheme 设置成想要的方案,也可以在 Wrapping and Braces 中修改 Hard wrap at 为 120 ,以达到想要的效果
版本相关
Unsupported major.minor version 52.0
此类报错,是因为用低版本 JDK 去运行高版本的 Java 程序了
| JDK 版本 | Major Version Number |
|---|---|
| Java SE 11 | 55 |
| Java SE 10 | 54 |
| Java SE 9 | 53 |
| Java SE 8 | 52 |
| Java SE 7 | 51 |
| Java SE 6.0 | 50 |
| Java SE 5.0 | 49 |
| JDK 1.4 | 48 |
| JDK 1.3 | 47 |
| JDK 1.2 | 46 |
| JDK 1.1 | 45 |
Maven 相关
需要正确地在 Maven 的 checkstyle 插件的 Regexp 正则中使用 XML 关键字
如果不对下面 5 个符号加 / 反斜杠转义的话,就需要使用 HTML 来表示
| 原始符号 | 含义 | HTML |
|---|---|---|
| $/lt$ | 小于 | < |
| $/gt$ | 大于 | > |
| & | 和 | & |
| ‘ | 单引号 | ' |
| “ | 双引号 | " |
Logback 相关
日志文件过大
描述
多个 JVM 进程将日志写入同一个日志文件中,导致按照文件大小切割的策略失效, xxx.log.1 会持续写下去,以至于磁盘被撑爆
解决
在日志路径上增加 ${JVM_PREFIX} 变量,并在不同的 JVM 启动的时候,通过 -DJVM_PREFIX="process001" 的方式传入,使得不同的 JVM 进程将日志写入各自的日志文件中
参考
- logback 变量
JVM 相关
Too small initial heap
-Xmx1024 -Xms512 应改为 -Xmx1024M -Xms512M
如何计算 Java 对象实际占用内存
- 一个 Java 对象到底占用多大内存?
- Java 对象占用空间大小计算
- Java 中 int 与 byte 数组互转代码详细分析
- Java 基础【04】数组内存分配
- Java 对象内存布局
- Hotspot GC 研究 - 64 位引用指针压缩技术
- 在线文件大小(bit,bytes,KB,MB,GB,TB)转换换算
G1GC 报错 To-space Exhausted
描述
2018-08-12T00:52:36.255+0800: 17308164.871: [GC pause (G1 Evacuation Pause) (young) (to-space exhausted), 2.3349764 secs]
   [Parallel Time: 331.1 ms, GC Workers: 23]
      [GC Worker Start (ms): Min: 17308164872.2, Avg: 17308164872.3, Max: 17308164872.3, Diff: 0.2]
      [Ext Root Scanning (ms): Min: 0.7, Avg: 1.0, Max: 3.1, Diff: 2.4, Sum: 23.1]
      [Update RS (ms): Min: 56.3, Avg: 58.3, Max: 59.2, Diff: 2.9, Sum: 1341.8]
         [Processed Buffers: Min: 75, Avg: 95.6, Max: 133, Diff: 58, Sum: 2199]
      [Scan RS (ms): Min: 0.8, Avg: 1.4, Max: 1.5, Diff: 0.7, Sum: 33.0]
      [Code Root Scanning (ms): Min: 0.0, Avg: 0.0, Max: 0.0, Diff: 0.0, Sum: 0.1]
      [Object Copy (ms): Min: 269.3, Avg: 269.5, Max: 269.8, Diff: 0.6, Sum: 6197.7]
      [Termination (ms): Min: 0.0, Avg: 0.4, Max: 0.6, Diff: 0.5, Sum: 9.3]
         [Termination Attempts: Min: 1, Avg: 290.0, Max: 325, Diff: 324, Sum: 6669]
      [GC Worker Other (ms): Min: 0.0, Avg: 0.1, Max: 0.2, Diff: 0.2, Sum: 3.0]
      [GC Worker Total (ms): Min: 330.7, Avg: 330.8, Max: 331.0, Diff: 0.3, Sum: 7608.0]
      [GC Worker End (ms): Min: 17308165202.9, Avg: 17308165203.0, Max: 17308165203.1, Diff: 0.2]
   [Code Root Fixup: 0.2 ms]
   [Code Root Purge: 0.0 ms]
   [Clear CT: 1.1 ms]
   [Other: 2002.7 ms]
      [Evacuation Failure: 779.0 ms]
      [Choose CSet: 0.0 ms]
      [Ref Proc: 1217.9 ms]
      [Ref Enq: 1.6 ms]
      [Redirty Cards: 0.8 ms]
      [Humongous Register: 0.2 ms]
      [Humongous Reclaim: 0.9 ms]
      [Free CSet: 1.5 ms]
   [Eden: 8520.0M(8520.0M)->0.0B(3536.0M) Survivors: 368.0M->440.0M Heap: 14.8G(16.0G)->10.4G(16.0G)]
 [Times: user=25.22 sys=0.29, real=2.33 secs]
原因
在日志中看到类似 Evacuation Failure、To-space Exhausted 或者 To-space Overflow 这样的输出(取决于不同版本的 JVM,输出略有不同)。这是 G1GC 收集器在将某个需要垃圾回收的分区进行回收时,无法找到一个能将其中存活对象拷贝过去的空闲分区。这种情况被称为 Evacuation Failure,常常会引发 Full GC
解决
- 增加
-XX:G1ReservePercent选项的值(并相应增加总的堆大小),为 目标空间 增加预留内存量 - 将
-XX:InitiatingHeapOccupancyPercent参数调低(默认值是45),可以使 G1GC 收集器更早开始 Mixed GC;但另一方面,会增加 GC 发生频率 - 提高
-XX:ConcGCThreads的值,在 Mixed GC 阶段投入更多的并发线程,争取提高每次暂停的效率。但是此参数会占用一定的有效工作线程资源
正文到此结束
- 本文标签: Logback parse value 锁 zip build 源码 ECS 自动化 message https 自动生成 数据库 MQ zookeeper 本质 IDE session 多线程 Proxy 空间 druid 遍历 key 开发 update example 测试 ask db 线程池 git ORM Oracle 垃圾回收 HBase 工程师 数据 ConcurrentHashMap FIT synchronized 设计模式 stream 解析 XML 操作系统 java 详细分析 协议 DDL remote Logging struct bean grep Collection 安全 bug UI HashMap API Full GC 软件工程师 HTML 2019 Collections 参数 rmi Connection 编译 core 端口 下载 ip Service find IO apr rabbitmq Region javaagent 管理 字节码 时间 junit 部署 json REST 目录 同步 root src windows python mina Action tar NIO HDFS id 配置 性能优化 关键技术 JVM 需求 限流 程序员 rand 实例 软件 mysql provider web lib cmd ACE 占用空间 函数式编程 图片 cat 服务端 安装 EXHAUSTED NSA equals 代码 Agent App HashSet DOM 插件 linux 总结 apache dist tab 删除 maven Features 突破 executor 进程 希望 map mongo Menu ArrayList GitHub zab CTO 并发 Document list final wget client Hadoop http jenkins Security js cache 线程 虚拟内存 sql 乱码 Bootstrap LinkedList Google 缓存 CEO
- 版权声明: 本文为互联网转载文章,出处已在文章中说明(部分除外)。如果侵权,请联系本站长删除,谢谢。
- 本文海报: 生成海报一 生成海报二
热门推荐


相关文章

近期评论
-
你这基本没有更新呀,最近文章显示还是2019年的文章。不符合要求哈
-
关键词:慕云博客 链接:https://www.lilun.me 描述:分享原创文字的个人博客
-
-
-
可以提供一下源码吗
-
不是商业站,鸡娃学习笔记
-
-
-
-
听他们说很厉害的样子
Loading...
![[HBLOG]公众号](http://www.liuhaihua.cn/img/qrcode_gzh.jpg)

