java应用监测(8)-阿里诊断工具arthas
上一篇文章 《java应用监测(7)-在线动态诊断神器BTrace》 我们提到,如果需要不停服务情况下对线上应用进行监测,需要使用动态追踪技术, BTrace 是很好动态追踪工具,但是使用起来还是有点复杂(需要写脚本),那么有没有更简单一点的工具,那就是 Arthas 了,它是阿里开源的Java诊断工具,进一步简化了动态追踪技术,有了它,可以直接查看类加载信息、JVM信息、线程堆栈信息、追踪方法执行情况,反编译类文件等,基本涵盖了前面提到的java命令行工具的功能和 BTrace 的功能。无需太多额外工作,只需熟悉 Arthas 提供的命令即可,很方便。其实 Arthas 底层跟 BTrace 一样,是基于 jvm Agent 方式,使用 Instrumentation 方式修改字节码方式然后执行、输出。本文将对 Arthas 的使用进行介绍,鉴于官方文档已经写得很详细,建议大家直接阅读官方文档来学习,本文只作抛砖引玉便可。官网地址: https://alibaba.github.io/arthas
2 Arthas安装与运行
2.1 下载Arthas
官方推荐直接下载jar运行
wget https://alibaba.github.io/arthas/arthas-boot.jar
复制代码
2.2 运行Arthas
把下载好的 arthas-boot.jar 包放到想要监测的java应用所在服务器,跟 Spring Boot 应用一样,直接使用java命令运行即可。
java -jar arthas-boot.jar
复制代码
注意:
--repo-mirror aliyun --use-http
jps -l
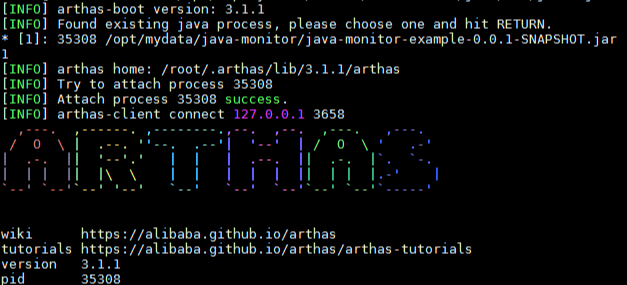
启动后即进行 Arthas 的命令行界面,可以使用 Arthas 提供的命令来实现需要监测的功能。如下图,需要监测的java应用是示例 java-monitor-example 。
2.3 退出
如果只是退出当前的连接,可以用 quit 或者 exit 命令。Attach到目标进程上的arthas还会继续运行,端口会保持开放,下次连接时可以直接连接上。
如果想完全退出arthas,可以执行 shutdown 命令。
3 Arthas使用
Arthas 的使用就是需要学会使用它提供的命令功能,主要分为几大类:
- 基本命令:
help、cat、pwd、history,quit等等,跟linux的命令差不多。 - jvm相关:
dashboard、thread、jvm、sysenv等等,主要是对JVM信息的监测,跟之前学习java命令行工具jinfo、jmap、jstack等有异曲同工之妙。 - class/classloader相关:
sc、sm、jad、dump、classloader等等。 - monitor/watch/trace相关:
monitor、watch、trace、stack等等,这些功能基本涵盖了BTrace中所实现的功能,包括定时检测,方法参数,返回值,调用时长等。
下面对常用的几个命令进行说明,详细的命令列表请查阅官方文档。
3.1 概览: dashboard
启动 Arthas 后, -h 查看使用帮助:
$ dashboard -h
 USAGE:
   dashboard [-b] [-h] [-i <value>] [-n <value>]

 SUMMARY:
   Overview of target jvm's thread, memory, gc, vm, tomcat info.

 EXAMPLES:
   dashboard
   dashboard -n 10
   dashboard -i 2000

复制代码
相当于概览,在一个界面中显示线程、内存、gc情况,vm情况和tomcat信息。如下图(官方文档的示例图):
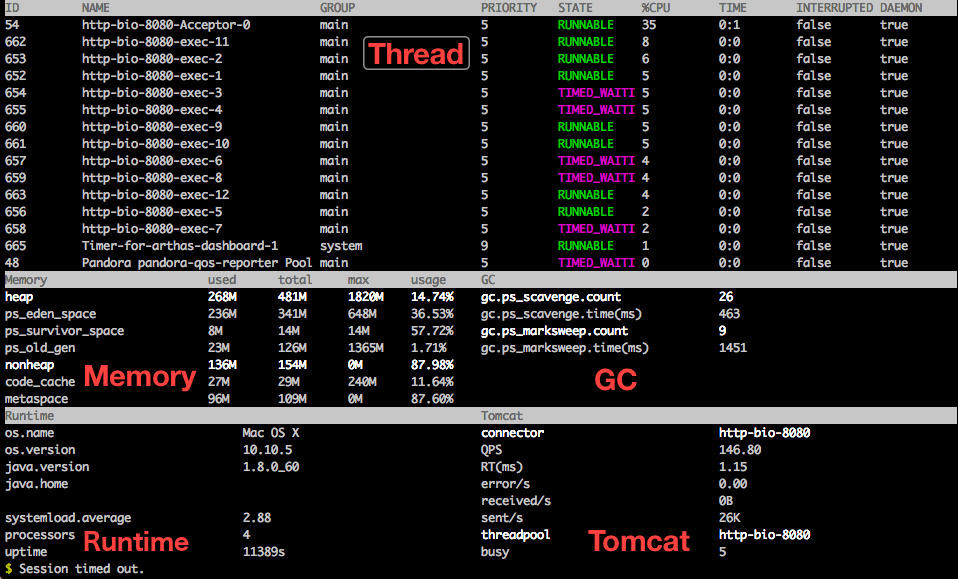
这个概览的信息默认5秒刷新一次,对于内存变化,线程占用情况,GC次数,一目了然。使用 ctrl+c 退出。
3.2 线程信息: thread
还记得 jstack 吗,我们需要先找出线程ID,使用它导出线程堆栈,然后使用线程ID查看。在 Arthas 中就方便多了,像上面 dashboard 中,已经有ID,直接使用 thread id 即可。 -h 查看帮助文档:
$ thread -h
 USAGE:
   thread [-h] [-b] [-i <value>] [-n <value>] [id]

 SUMMARY:
   Display thread info, thread stack

 EXAMPLES:
   thread
   thread 51
   thread -n -1
   thread -n 5
   thread -b
   thread -i 2000

 OPTIONS:
 -h, --help  this help
 -b, --include-blocking-thread  Find the thread who is holding a lock that blocks the most number of threads.
 -i, --sample-interval <value>  Specify the sampling interval (in ms) when calculating cpu usage.
 -n, --top-n-threads <value>   The number of thread(s) to show, ordered by cpu utilization, -1 to show all.
 <id>  Show thread stack
复制代码
如上面所示的 EXAMPLES ,使用 thread 命令,可以找出占用CPU最高前N个线程( -n ),可以打印指定线程的运行堆栈( id ),找出当前阻塞其他线程的线程( -b ),由此来分析线程问题很方便。
3.3 JVM信息: jvm
jvm 命令很简单,没有参数,它输出的信息包括运行参数,类加载信息, 内存情况,系统信息,线程数信息,文件描述符等。有点像 jvisualvm 的中 概述 ,但比它更详细。
3.4 反编译: jad
有时需要检测线上运行的应用中,新的代码是否有使用或者是否有更新到,可以把加载的类反编译出来,查看源码是否为最新的,这时 jad 就很有用。 -h 打印使用帮助:
$ jad -h
 USAGE:
   jad [-c <value>] [-h] [-E] [--source-only] class-pattern [method-name]

 EXAMPLES:
   jad java.lang.String
   jad java.lang.String toString
   jad --source-only java.lang.String
   jad -c 39eb305e org/apache/log4j/Logger
   jad -c 39eb305e -E org//.apache//.*//.StringUtils

 OPTIONS:
 -c, --code <value>  The hash code of the special class's classLoader
 -h, --help          this help
 -E, --regex         Enable regular expression to match (wildcard matching by default)
     --source-only   Output source code only
 <class-pattern>     Class name pattern, use either '.' or '/' as separator
 <method-name>       method name pattern, decompile a specific method instead of the whole class

复制代码
如上面所示的 EXAMPLES ,jad可以反编译类( class-pattern ),反编译类的某个方法( method-name ),如果有多个 classLoader ,还可以使用 -c 来选择显示哪个等。
3.5 方法执行监控: monitor
monitor 可以定时输出方法的执行情况进行监控,包括调用次数,成功次数,失败次数,平均时长,失败率等,有点像 BTrace 中的 @Timer ,但是更方便。 -h 查看使用帮助:
$ monitor -h
 USAGE:
   monitor [-c <value>] [-h] [-n <value>] [-E] class-pattern method-pattern

 SUMMARY:
   Monitor method execution statistics, e.g. total/success/failure count, average rt, fail rate, etc.

 Examples:
   monitor org.apache.commons.lang.StringUtils isBlank
   monitor org.apache.commons.lang.StringUtils isBlank -c 5
   monitor -E org/.apache/.commons/.lang/.StringUtils isBlank

 OPTIONS:
 -c, --cycle <value>    The monitor interval (in seconds), 60 seconds by default
 -h, --help             this help
 -n, --limits <value>   Threshold of execution times
 -E, --regex            Enable regular expression to match (wildcard matching by default)
 <class-pattern>        Path and classname of Pattern Matching
 <method-pattern>       Method of Pattern Matching
复制代码
如上面所示的 EXAMPLES ,可以监测方法执行情况,默认是60s输出一次,可以使用 -c 来修改输出间隔时间。
3.6 方法执行数据监测: watch
类似于 BTrace 的 @OnMethod ,若想在线上的应用中把执行方法时的参数,返回值,异常信息, watch 命令就非常合适。 -h 使用帮助:
$ watch -h
 USAGE:
   watch [-b] [-e] [-x <value>] [-f] [-h] [-n <value>] [-E] [-M <value>] [-s] class-pattern method-pattern express [condition-express]

 SUMMARY:
   Display the input/output parameter, return object, and thrown exception of specified method invocation
   The express may be one of the following expression (evaluated dynamically):
           target : the object
            clazz : the object's class
           method : the constructor or method
           params : the parameters array of method
     params[0..n] : the element of parameters array
        returnObj : the returned object of method
         throwExp : the throw exception of method
         isReturn : the method ended by return
          isThrow : the method ended by throwing exception
            #cost : the execution time in ms of method invocation
 Examples:
   watch -b org.apache.commons.lang.StringUtils isBlank params
   watch -f org.apache.commons.lang.StringUtils isBlank returnObj
   watch org.apache.commons.lang.StringUtils isBlank '{params, target, returnObj}' -x 2
   watch -bf *StringUtils isBlank params
   watch *StringUtils isBlank params[0]
   watch *StringUtils isBlank params[0] params[0].length==1
   watch *StringUtils isBlank params '#cost>100'
   watch -E -b org/.apache/.commons/.lang/.StringUtils isBlank params[0]
 OPTIONS:
 -b, --before         Watch before invocation
 -e, --exception      Watch after throw exception
 -x, --expand <value>    Expand level of object (1 by default)
 -f, --finish         Watch after invocation, enable by default
 -h, --help           this help
 -n, --limits <value>   Threshold of execution times
 -E, --regex    Enable regular expression to match (wildcard matching by default)
 -M, --sizeLimit <value>   Upper size limit in bytes for the result (10 * 1024 * 1024 by default)
 -s, --success      Watch after successful invocation
 <class-pattern>    The full qualified class name you want to watch
 <method-pattern>   The method name you want to watch
 <express>          the content you want to watch, written by ognl.
			        Examples:
			              params
			              params[0]
			              'params[0]+params[1]'
			              '{params[0], target, returnObj}'
			              returnObj
			              throwExp
			              target
			              clazz
			              method

复制代码
如上面所示的 EXAMPLES ,监测时机分别是方法执行前( -b ),方法执行结束( -f ,默认值),方法执行成功( -s )。监测内容包括:参数( params ),返回值( returnObj ),异常( throwExp )等。
4 总结
Arthas 的强大功能,基本可以对java应用进行全面的监测,是线上应用监测的好帮手,本文相对比较简单地对 Arthas 的安装和使用进行入门讲解,抛砖引玉,希望大家能上 Arthas 官方网站进一步学习,里面已经对各命令都有详细的讲解和示例,从而让自己的java监测技术更扎实。
正文到此结束
- 本文标签: ssl js map value http id 服务器 https 网站 CTO src 希望 apache git cat 时间 lib IO Agent wget struct 进程 代码 example 下载 字节码 java tomcat 线程 GitHub jvisualvm 神器 JVM spring 端口 find 数据 开源 文章 Dashboard linux 源码 tar UI 总结 ACE Lua 编译 安装 参数 jstack Spring Boot
- 版权声明: 本文为互联网转载文章,出处已在文章中说明(部分除外)。如果侵权,请联系本站长删除,谢谢。
- 本文海报: 生成海报一 生成海报二
热门推荐


相关文章

近期评论
-
你这基本没有更新呀,最近文章显示还是2019年的文章。不符合要求哈
-
关键词:慕云博客 链接:https://www.lilun.me 描述:分享原创文字的个人博客
-
-
-
可以提供一下源码吗
-
不是商业站,鸡娃学习笔记
-
-
-
-
听他们说很厉害的样子
Loading...
![[HBLOG]公众号](http://www.liuhaihua.cn/img/qrcode_gzh.jpg)

