NFV Spring Cloud Sleuth综合
| 编辑推荐: |
| 本文来自于csdn,文章主要介绍了Spring Cloud Sleuth的介绍、相关术语定义,Span和Trace在系统中的外观以及Zipkin注解以及如何在项目中添加Sleuth等相关内容。 |
1.介绍
Spring Cloud Sleuth为Spring Cloud实现了分布式跟踪解决方案。
1.1术语
Spring Cloud Sleuth借用了Google
Dapper的术语。
Span:工作的基本单位。例如,发送RPC是一个新的跨度,就像发送响应到RPC一样。Span是由一个唯一的64位ID来标识的,而另一个64位ID用于跟踪。span还具有其他数据,如描述、时间戳事件、键值标注(标记)、导致它们的span的ID和进程ID(通常是IP地址)。
可以启动和停止跨度,并跟踪其时间信息。 创建跨度后,必须在将来的某个时刻停止它。
启动跟踪的初始范围称为根跨度。 该范围的ID值等于跟踪ID。
Trace:一组span形成树状结构。 例如,如果运行分布式大数据存储,则可能由PUT请求形成跟踪。
注解:用于及时记录事件的存在。 使用Brave工具,我们不再需要为Zipkin设置特殊事件,以了解客户端和服务器是谁,请求开始的位置以及结束位置。
cs:客户已发送。 客户提出了请求。 此注释表示跨度的开始。
sr:Server Received:服务器端获得请求并开始处理它。 从此时间戳中减去cs时间戳会显示网络延迟。
ss:服务器已发送。 在完成请求处理时(当响应被发送回客户端时)注释。 从此时间戳中减去sr时间戳会显示服务器端处理请求所需的时间。
cr:客户收到了。 表示跨度的结束。 客户端已成功收到服务器端的响应。 从此时间戳中减去cs时间戳会显示客户端从服务器接收响应所需的全部时间。
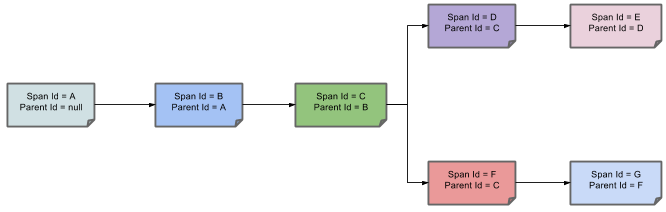
下图显示了Span和Trace在系统中的外观以及Zipkin注解:

注释的每种颜色表示跨度(有七个跨度 - 从A到G)。 请考虑以下注释:
此注释表示当前跨度的Trace Id设置为X,Span Id设置为D.此外,还发生了Client Sent事件。
Trace Id = X
Span Id = D
Client Sent
下图显示了跨度的父子关系:
1.2目的
以下部分参考上图中显示的示例。
1.2.1使用Zipkin进行分布式跟踪
这个例子有七个跨度。如果你在Zipkin中查看跟踪,你可以在第二个跟踪中看到这个数字,如下图所示:

但是,如果选择特定跟踪,则可以看到四个跨度,如下图所示:
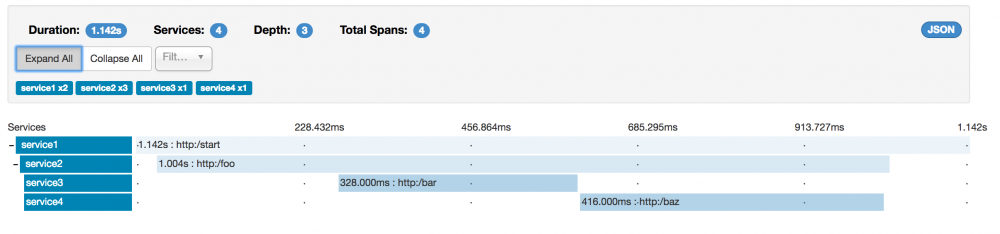
选择特定跟踪时,您会看到合并的跨度。 这意味着,如果通过Server Received和Server Sent或Client Received和Client Sent annotations向Zipkin发送了两个跨度,则它们将显示为单个跨度。
在这种情况下,为什么七个和四个跨度之间存在差异?
两个跨度来自http:/start span。它具有Server Received(sr)和Server Sent(ss)注释。
从Service1到service2到http:/foo端点的RPC调用有两个跨度。客户端发送(cs)和客户端接收(cr)事件发生在service1端。 Server Received(sr)和Server Sent(ss)事件发生在service2端。这两个跨度形成一个与RPC调用相关的逻辑跨度。
两个跨度来自从service2到service3的RPC调用到http:/bar端点。客户端发送(cs)和客户端接收(cr)事件发生在service2端。 Server Received(sr)和Server Sent(ss)事件发生在service3端。这两个跨度形成一个与RPC调用相关的逻辑跨度。
两个跨度来自从service2到service4的RPC调用到http:/baz端点。客户端发送(cs)和客户端接收(cr)事件发生在service2端。服务器已接收(sr)和服务器已发送(ss)事件发生在service4端。这两个跨度形成一个与RPC调用相关的逻辑跨度。
因此,如果我们计算物理跨度,我们有一个来自http:/ start,两个来自service1调用service2,两个来自service2调用service3,两个来自service2调用service4。 总之,我们总共有七个跨度。
从逻辑上讲,我们看到了四个总Spans的信息,因为我们有一个与service1的传入请求相关的span和三个与RPC调用相关的spans。
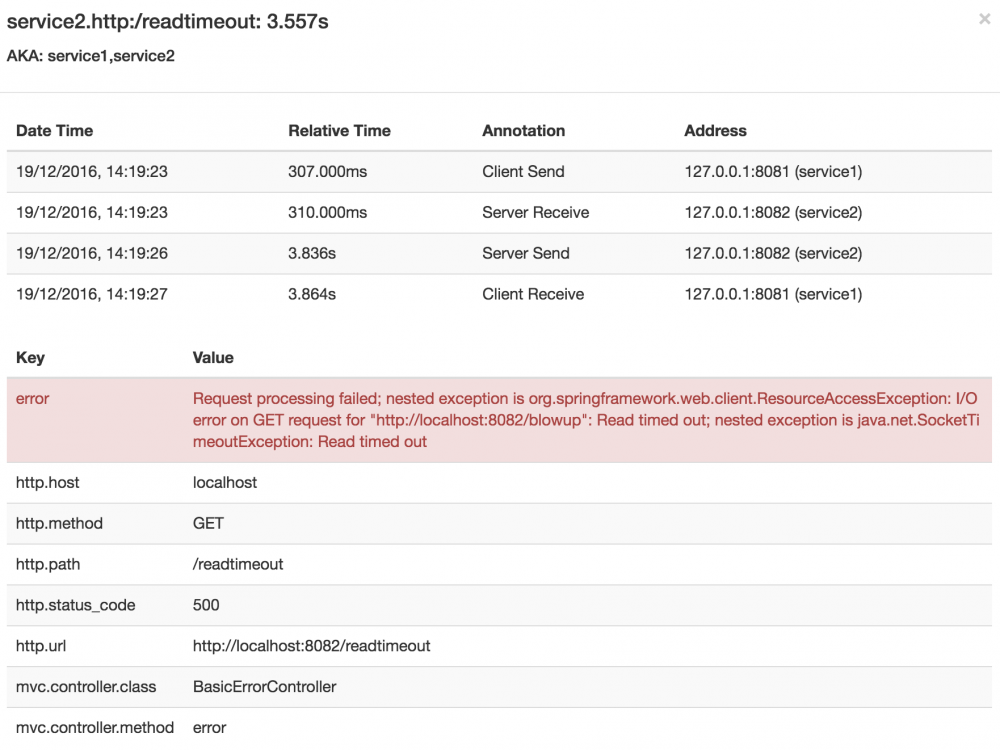
1.2.2 可视化错误
Zipkin允许您可视化Trace中的错误。 当抛出一个异常并且没有被捕获时,我们在跨度上设置了适当的标签,然后Zipkin可以正确地着色。 您可以在Trace列表中看到一条红色的迹线。 这似乎是因为抛出异常。
如果单击该跟踪,您将看到类似的图片,如下所示:

跨度显示错误的原因以及与之相关的整个堆栈跟踪。
1.2.3日志相关
当使用grep扫描一个等于(例如)2485ec27856c56f4的Trace ID来读取这四个应用程序的日志时,您会得到如下输出:
service1.log:2016-02-26 11:15:47.561 INFO [service1,2485ec27856c56f4,2485ec27856c56f4,true] 68058 --- [nio-8081-exec-1] i.s.c.sleuth.docs.service1.Application : Hello from service1. Calling service2
 service2.log:2016-02-26 11:15:47.710 INFO [service2,2485ec27856c56f4,9aa10ee6fbde75fa,true] 68059 --- [nio-8082-exec-1] i.s.c.sleuth.docs.service2.Application : Hello from service2. Calling service3 and then service4
 service3.log:2016-02-26 11:15:47.895 INFO [service3,2485ec27856c56f4,1210be13194bfe5,true] 68060 --- [nio-8083-exec-1] i.s.c.sleuth.docs.service3.Application : Hello from service3
 service2.log:2016-02-26 11:15:47.924 INFO [service2,2485ec27856c56f4,9aa10ee6fbde75fa,true] 68059 --- [nio-8082-exec-1] i.s.c.sleuth.docs.service2.Application : Got response from service3 [Hello from service3]
 service4.log:2016-02-26 11:15:48.134 INFO [service4,2485ec27856c56f4,1b1845262ffba49d,true] 68061 --- [nio-8084-exec-1] i.s.c.sleuth.docs.service4.Application : Hello from service4
 service2.log:2016-02-26 11:15:48.156 INFO [service2,2485ec27856c56f4,9aa10ee6fbde75fa,true] 68059 --- [nio-8082-exec-1] i.s.c.sleuth.docs.service2.Application : Got response from service4 [Hello from service4]
 service1.log:2016-02-26 11:15:48.182 INFO [service1,2485ec27856c56f4,2485ec27856c56f4,true] 68058 --- [nio-8081-exec-1] i.s.c.sleuth.docs.service1.Application : Got response from service2 [Hello from service2, response from service3 [Hello from service3] and from service4 [Hello from service4]]
如果使用日志聚合工具(例如Kibana,Splunk等),则可以对发生的事件进行排序。 Kibana的一个例子类似于下图:

如果要使用Logstash,以下列表显示了Logstash的Grok模式:
Logstash是一个具有实时流水线功能的开源数据收集引擎。 Logstash可以动态统一来自不同来源的数据,并将数据标准化为您选择的目的地。 为各种高级下游分析和可视化用例清理和民主化所有数据。
虽然Logstash最初推动了日志收集的创新,但其功能远远超出了该用例。 任何类型的事件都可以通过广泛的输入,过滤和输出插件进行丰富和转换,许多本机编解码器进一步简化了摄取过程。 Logstash通过利用更大容量和更多数据来加速您的见解。
Grok是Logstash过滤器的基础,可以无处不在地用于从非结构化数据中获取结构。 享受丰富的集成模式,旨在帮助快速解决Web,系统,网络和其他类型的事件格式。
filter {
 # pattern matching logback pattern
 grok {
 match => { "message" => "%{TIMESTAMP_ISO8601:timestamp}/s+%{LOGLEVEL:severity}/s+ /[%{DATA:service},%{DATA:trace},%{DATA:span},%{DATA:exportable}/]/s+%{DATA:pid}/s+---/s+/[%{DATA:thread}/]/s+%{DATA:class}/s+:/s+%{GREEDYDATA:rest}" }
 }
 }
注意:如果要将Grok与Cloud Foundry中的日志一起使用,则必须使用以下模式:
filter {
 # pattern matching logback pattern
 grok {
 match => { "message" => "(?m)OUT/s+%{TIMESTAMP_ISO8601:timestamp}/s +%{LOGLEVEL:severity}/s+/[%{DATA:service},%{DATA:trace},%{DATA:span}, %{DATA:exportable}/]/s+%{DATA:pid}/s+---/s+/[%{DATA:thread}/]/s+%{DATA:class}/s+:/s+%{GREEDYDATA:rest}" }
 }
 }
使用Logstash的JSON Logback
通常,您不希望将日志存储在一个文本文件中,而是存储在一个JSON文件中,logstash可以立即选择该文件。为此,您必须执行以下操作(为了可读性,我们传递groupId:artifactId:version notation中的依赖关系)。
依赖关系设置
1.确保Logback位于类路径上(ch.qos.logback:logback-core)。
<dependency>
 <groupId>ch.qos.logback</groupId>
 <artifactId>logback-core</artifactId>
 <version>${logback.version}</version>
 </dependency>
2.添加Logstash Logback编码。 例如,要使用版本4.6,请添加net.logstash.logback:logstash-logback-encoder:4.6。
<dependency>
 <groupId>net.logstash.logback</groupId>
 <artifactId>logstash-logback-encoder</artifactId>
 <version>4.6</version>
 </dependency>
3.增加Logback
请考虑以下Logback配置文件示例(名为logback-spring.xml)。
<?xml version="1.0" encoding="UTF-8"?>
 <configuration>
 <include resource="org/springframework/boot /logging/logback/defaults.xml"/>

 <springProperty scope="context" name="springAppName" source="spring.application.name"/>
 <!-- Example for logging into the build folder of your project -->
 <property name="LOG_FILE" value="${BUILD_FOLDER:-build }/${springAppName}"/>

 <!-- You can override this to have a custom pattern -->
 <property name="CONSOLE_LOG_PATTERN"
 value="%clr(%d{yyyy-MM-dd HH:mm:ss.SSS}){faint} %clr(${LOG_LEVEL_PATTERN:-%5p}) %clr(${PID:- }){magenta} %clr(---){faint} %clr([%15.15t]){faint} %clr(%-40.40logger{39}){cyan} %clr(:){faint} %m%n$ {LOG_EXCEPTION_CONVERSION_WORD:-%wEx}"/>

 <!-- Appender to log to console -->
 <appender name="console" class="ch.qos.logback.core.ConsoleAppender">
 <filter class="ch.qos.logback.classic.filter.ThresholdFilter">
 <!-- Minimum logging level to be presented in the console logs-->
 <level>DEBUG</level>
 </filter>
 <encoder>
 <pattern>${CONSOLE_LOG_PATTERN}</pattern>
 <charset>utf8</charset>
 </encoder>
 </appender>

 <!-- Appender to log to file -->?
 <appender name="flatfile" class="ch.qos.logback. core.rolling.RollingFileAppender">
 <file>${LOG_FILE}</file>
 <rollingPolicy class="ch.qos.logback.core.rolling. TimeBasedRollingPolicy">
 <fileNamePattern>${LOG_FILE}.%d {yyyy -MM-dd}.gz </fileNamePattern>
 <maxHistory>7</maxHistory>
 </rollingPolicy>
 <encoder>
 <pattern>${CONSOLE_LOG_PATTERN}</pattern>
 <charset>utf8</charset>
 </encoder>
 </appender>

 <!-- Appender to log to file in a JSON format -->
 <appender name="logstash" class="ch.qos.logback. core.rolling.RollingFileAppender">
 <file>${LOG_FILE}.json</file>
 <rollingPolicy class="ch.qos.logback.core. rolling.TimeBasedRollingPolicy">
 <fileNamePattern>${LOG_FILE}.json.%d {yyyy -MM-dd}.gz </fileNamePattern>
 <maxHistory>7</maxHistory>
 </rollingPolicy>
 <encoder class="net.logstash.logback.encoder. LoggingEventCompositeJsonEncoder">
 <providers>
 <timestamp>
 <timeZone>UTC</timeZone>
 </timestamp>
 <pattern>
 <pattern>
 {
 "severity": "%level",
 "service": "${springAppName:-}",
 "trace": "%X{X-B3-TraceId:-}",
 "span": "%X{X-B3-SpanId:-}",
 "parent": "%X{X-B3-ParentSpanId:-}",
 "exportable": "%X{X-Span-Export:-}",
 "pid": "${PID:-}",
 "thread": "%thread",
 "class": "%logger{40}",
 "rest": "%message"
 }
 </pattern>
 </pattern>
 </providers>
 </encoder>
 </appender>

 <root level="INFO">
 <appender-ref ref="console"/>
 <!-- uncomment this to have also JSON logs -->
 <!--<appender-ref ref="logstash"/>-->
 <!--<appender-ref ref="flatfile"/>-->
 </root>
 </configuration>
那个Logback配置文件:
将来自应用程序的信息以JSON格式记录到build/${spring.application.name}.json文件中。(在项目中)
已注释掉两个额外的appender:控制台和标准日志文件。
具有与上一节中介绍的相同的日志记录模式。
如果使用自定义logback-spring.xml,则必须在bootstrap.properties(yml)而不是应用application.properties(yml)中传递spring.application.name。 否则,您的自定义logback文件无法正确读取该属性。
1.3为项目添加Sleuth
重要
要确保您的应用程序名称在Zipkin中正确显示,请在bootstrap.yml中设置spring.application.name属性。
1.3.1只有Sleuth
<dependencyManagement>
 <dependencies>
 <dependency>
 <groupId>org.springframework.cloud</groupId>
 <artifactId>spring-cloud-dependencies</artifactId>
 <version>${release.train.version}</version>
 <type>pom</type>
 <scope>import</scope>
 </dependency>
 </dependencies>
 </dependencyManagement>

 <dependency>
 <groupId>org.springframework.cloud</groupId>
 <artifactId>spring-cloud-starter-sleuth</artifactId>
 </dependency>
我们建议您通过Spring BOM添加依赖关系管理,这样您就无需自行管理版本。【springboot springcloud推荐的添加方式】
将依赖项添加到spring-cloud-starter-sleuth。
1.3.2通过HTTP与Zipkin的Sleuth
<dependencyManagement>
 <dependencies>
 <dependency>
 <groupId>org.springframework.cloud</groupId>
 <artifactId>spring-cloud-dependencies</artifactId>
 <version>${release.train.version}</version>
 <type>pom</type>
 <scope>import</scope>
 </dependency>
 </dependencies>
 </dependencyManagement>

 <dependency>
 <groupId>org.springframework.cloud</groupId>
 <artifactId>spring-cloud-starter-zipkin</artifactId>
 </dependency>
我们建议您通过Spring BOM添加依赖关系管理,这样您就无需自行管理版本。
将依赖项添加到spring-cloud-starter-zipkin。
如果spring-cloud-sleuth-zipkin可用,则该应用程序将通过HTTP生成并收集与Zipkin兼容的跟踪。 默认情况下,它将它们发送到localhost(端口9411)上的Zipkin收集器服务。 使用spring.zipkin.baseUrl配置服务的位置。
注意:您可以设置logging.level.org.springframework. web.servlet.DispatcherServlet = DEBUG,而不是在处理程序中明确记录请求。
注意:如果使用Zipkin,请通过设置(对于2.0.x)spring.sleuth.sampler.probability或(直到2.0.x)spring.sleuth.sampler.percentage(默认值:0.1,这是 10%,Sleuth会忽略掉大量的span)。 否则,您可能会认为侦探无效,因为它忽略了一些跨度。
注意:设置spring.application.name = bar(例如)以查看服务名称以及跟踪和跨度ID。
1.3.3在RabbitMQ或Kafka上使用Zipkin的Sleuth
如果您想使用RabbitMQ或Kafka而不是HTTP,请添加spring-rabbit或spring-kafka依赖项。默认的目的地名是zipkin。
如果使用Kafka,则必须设置属性spring.zipkin.sender。类型相应的属性:
spring.zipkin.sender.type: kafka
警告:spring-cloud-sleuth-stream已弃用且与这些目标不兼容。
如果你想通过RabbitMQ上的Sleuth,添加spring-cloud-starter-zipkin和spring-rabbit依赖项。
Maven
<dependencyManagement>
 <dependencies>
 <dependency>
 <groupId>org.springframework.cloud</groupId>
 <artifactId>spring-cloud-dependencies</artifactId>
 <version>${release.train.version}</version>
 <type>pom</type>
 <scope>import</scope>
 </dependency>
 </dependencies>
 </dependencyManagement>

 <dependency>
 <groupId>org.springframework.cloud</groupId>
 <artifactId>spring-cloud-starter-zipkin</artifactId>
 </dependency>
 <dependency>
 <groupId>org.springframework.amqp</groupId>
 <artifactId>spring-rabbit</artifactId>
 </dependency>
我们建议您通过Spring BOM添加依赖项管理,这样您就不需要自己管理版本。
将依赖项添加到spring-cloud-starter-zipkin。这样,所有嵌套的依赖项都会被下载。
要自动配置RabbitMQ,请添加spring-rabbit依赖项。
2.发送span到Zipkin
默认情况下,如果将spring-cloud-starter-zipkin添加为项目的依赖项,则当跨度关闭时,它将通过HTTP发送到Zipkin。 通信是异步的。 您可以通过设置spring.zipkin.baseUrl属性来配置URL,如下所示:
spring.zipkin.baseUrl: http://192.168.99.100:9411/
如果您想通过服务发现找到Zipkin,您可以在URL中传递Zipkin的服务ID,如以下zipkinserver服务ID示例所示:
spring.zipkin.baseUrl: http://zipkinserver/
要禁用此功能,只需将spring.zipkin.discoveryClientEnabled设置为false。
启用Discovery Client功能后,Sleuth使用LoadBalancerClient查找Zipkin Server的URL。 这意味着您可以设置负载平衡配置,例如 通过功能区
zipkinserver:
ribbon:
ListOfServers: host1,host2
如果您在类路径上一起使用web,rabbit或kafka,则可能需要选择要将spans发送到zipkin的方法。 为此,请将web,rabbit或kafka设置为spring.zipkin.sender.type属性。 以下示例显示为web设置发件人类型:
spring.zipkin.sender.type: web
3.Span数据作为消息
您可以通过将spring-cloud-sleuth-stream jar包含为依赖项来累积和发送Spring Cloud的跨度数据,并添加Channel Binder实现(例如,用于RabbitMQ的spring-cloud-starter-stream-rabbit或Kafka的spring-cloud-starter-stream-kafka)。 这将自动将您的应用程序转换为有效负载类型为Spans的消息的生成者。
Zipkin消费者
有一个特殊的便利注释,用于为Span数据设置消息使用者并将其推送到Zipkin SpanStore。
@SpringBootApplication
 @EnableZipkinStreamServer
 public class Consumer {
 public static void main(String[] args) {
 SpringApplication.run(Consumer.class, args);
 }
 }
将通过Spring Cloud Stream Binder监听您提供的任何传输的Span数据(例如,包括用于RabbitMQ的spring-cloud-starter-stream-rabbit,以及Redis和Kafka的类似启动器)。 如果添加以下UI依赖项
<groupId>io.zipkin.java</groupId>
<artifactId>zipkin-autoconfigure-ui</artifactId>
默认的SpanStore是内存中的(适用于演示和快速入门)。 对于更强大的解决方案,您可以将MySQL和spring-boot-starter-jdbc添加到类路径中,并通过配置启用JDBC SpanStore。
 spring:
 rabbitmq:
 host: ${RABBIT_HOST:localhost}
 datasource:
 schema: classpath:/mysql.sql
 url: jdbc:mysql://${MYSQL_HOST:localhost}/test
 username: root
 password: root
 # Switch this on to create the schema on startup:
 initialize: true
 continueOnError: true
 sleuth:
 enabled: false
 zipkin:
 storage:
 type: mysql
mysql脚本
CREATE TABLE IF NOT EXISTS zipkin_spans (
 `trace_id_high` BIGINT NOT NULL DEFAULT 0 COMMENT 'If non zero, this means the trace uses 128 bit traceIds instead of 64 bit',
 `trace_id` BIGINT NOT NULL,
 `id` BIGINT NOT NULL,
 `name` VARCHAR(255) NOT NULL,
 `parent_id` BIGINT,
 `debug` BIT(1),
 `start_ts` BIGINT COMMENT 'Span.timestamp(): epoch micros used for endTs query and to implement TTL',
 `duration` BIGINT COMMENT 'Span.duration(): micros used for minDuration and maxDuration query'
 ) ENGINE=InnoDB ROW_FORMAT=COMPRESSED CHARACTER SET=utf8 COLLATE utf8_general_ci;

 ALTER TABLE zipkin_spans ADD UNIQUE KEY(`trace_id_high`, `trace_id`, `id`) COMMENT 'ignore insert on duplicate';
 ALTER TABLE zipkin_spans ADD INDEX(`trace_id_high`, `trace_id`, `id`) COMMENT 'for joining with zipkin_annotations';
 ALTER TABLE zipkin_spans ADD INDEX(`trace_id_high`, `trace_id`) COMMENT 'for getTracesByIds';
 ALTER TABLE zipkin_spans ADD INDEX(`name`) COMMENT 'for getTraces and getSpanNames';
 ALTER TABLE zipkin_spans ADD INDEX(`start_ts`) COMMENT 'for getTraces ordering and range';

 CREATE TABLE IF NOT EXISTS zipkin_annotations (
 `trace_id_high` BIGINT NOT NULL DEFAULT 0 COMMENT 'If non zero, this means the trace uses 128 bit traceIds instead of 64 bit',
 `trace_id` BIGINT NOT NULL COMMENT 'coincides with zipkin_spans.trace_id',
 `span_id` BIGINT NOT NULL COMMENT 'coincides with zipkin_spans.id',
 `a_key` VARCHAR(255) NOT NULL COMMENT 'BinaryAnnotation.key or Annotation.value if type == -1',
 `a_value` BLOB COMMENT 'BinaryAnnotation.value(), which must be smaller than 64KB',
 `a_type` INT NOT NULL COMMENT 'BinaryAnnotation.type() or -1 if Annotation',
 `a_timestamp` BIGINT COMMENT 'Used to implement TTL; Annotation.timestamp or zipkin_spans.timestamp',
 `endpoint_ipv4` INT COMMENT 'Null when Binary/Annotation.endpoint is null',
 `endpoint_ipv6` BINARY(16) COMMENT 'Null when Binary/Annotation.endpoint is null, or no IPv6 address',
 `endpoint_port` SMALLINT COMMENT 'Null when Binary/Annotation.endpoint is null',
 `endpoint_service_name` VARCHAR(255) COMMENT 'Null when Binary/Annotation.endpoint is null'
 ) ENGINE=InnoDB ROW_FORMAT=COMPRESSED CHARACTER SET=utf8 COLLATE utf8_general_ci;

 ALTER TABLE zipkin_annotations ADD UNIQUE KEY(`trace_id_high`, `trace_id`, `span_id`, `a_key`, `a_timestamp`) COMMENT 'Ignore insert on duplicate';
 ALTER TABLE zipkin_annotations ADD INDEX(`trace_id_high`, `trace_id`, `span_id`) COMMENT 'for joining with zipkin_spans';
 ALTER TABLE zipkin_annotations ADD INDEX(`trace_id_high`, `trace_id`) COMMENT 'for getTraces/ByIds';
 ALTER TABLE zipkin_annotations ADD INDEX(`endpoint_service_name`) COMMENT 'for getTraces and getServiceNames';
 ALTER TABLE zipkin_annotations ADD INDEX(`a_type`) COMMENT 'for getTraces';
 ALTER TABLE zipkin_annotations ADD INDEX(`a_key`) COMMENT 'for getTraces';
 ALTER TABLE zipkin_annotations ADD INDEX(`trace_id`, `span_id`, `a_key`) COMMENT 'for dependencies job';

 CREATE TABLE IF NOT EXISTS zipkin_dependencies (
 `day` DATE NOT NULL,
 `parent` VARCHAR(255) NOT NULL,
 `child` VARCHAR(255) NOT NULL,
 `call_count` BIGINT,
 `error_count` BIGINT
 ) ENGINE=InnoDB ROW_FORMAT=COMPRESSED CHARACTER SET=utf8 COLLATE utf8_general_ci;

 ALTER TABLE zipkin_dependencies ADD UNIQUE KEY(`day`, `parent`, `child`);
@EnableZipkinStreamServer也使用@EnableZipkinServer进行注释,因此该过程还将公开标准的Zipkin服务器端点,以便通过HTTP收集跨度,以及在Zipkin Web UI中进行查询。
4.Zipkin Stream Span消费者
重要:建议使用Zipkin对基于消息的跨度发送的本机支持。 从Edgware版本开始,不推荐使用Zipkin Stream服务器。 在Finchley发布中,它已被删除。
正文到此结束
- 本文标签: tag spring 端口 js 数据 NFV list schema Word Service 分布式 ribbon Logback mysql tab https UI SDN value dataSource 删除 Property id Spring cloud stream classpath ip 配置 Google key consumer http message 希望 springcloud 服务器 servlet sql 管理 XML provider core Logging MQ bug Agent root cat 大数据 json 开源 src Job IO Kibana JDBC web pom 进程 Bootstrap App dependencies client 下载 NIO rabbitmq Spring Cloud Sleuth 2019 zip maven grep IDE 注释 REST build 文章 图片 springboot Sleuth UTC java db tar redis 时间 插件 example ACE ORM zipkin amqp
- 版权声明: 本文为互联网转载文章,出处已在文章中说明(部分除外)。如果侵权,请联系本站长删除,谢谢。
- 本文海报: 生成海报一 生成海报二
热门推荐


相关文章

近期评论
-
你这基本没有更新呀,最近文章显示还是2019年的文章。不符合要求哈
-
关键词:慕云博客 链接:https://www.lilun.me 描述:分享原创文字的个人博客
-
-
-
可以提供一下源码吗
-
不是商业站,鸡娃学习笔记
-
-
-
-
听他们说很厉害的样子
Loading...
![[HBLOG]公众号](http://www.liuhaihua.cn/img/qrcode_gzh.jpg)

