基于自定义Istio指标的Pod水平自动缩放
作者:Sandor Magyari
译者:张成
审校:罗广明
原文: https://banzaicloud.com/blog/...
本文来自Banzai Cloud,通过一个spring-boot应用示例演示如何通过Istio operator来实现pod水平扩展。
基于自定义Istio指标的Pod水平自动缩放
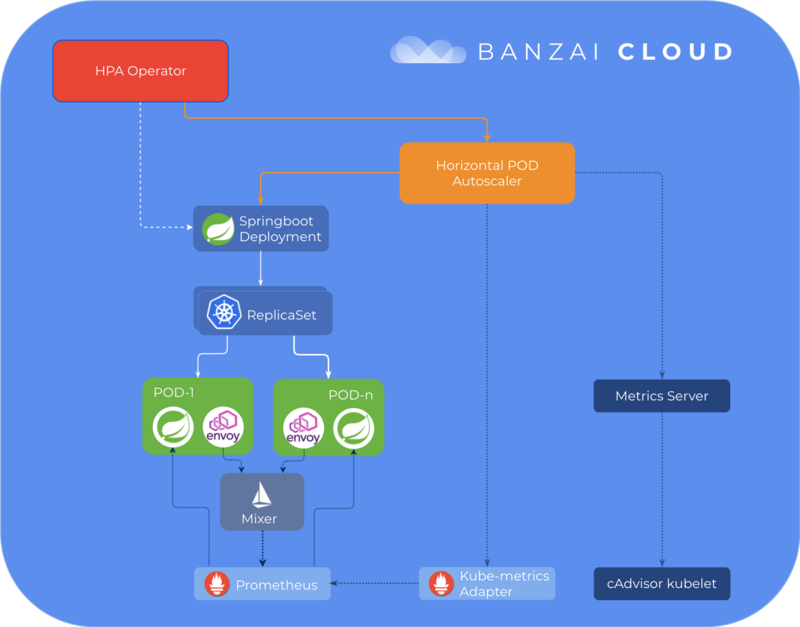
Pipeline 的核心功能之一,Banzai Cloud的应用程序和devops容器管理 平台 ,是多维的并可以基于默认和自定义指标进行自动调节。 在我们引入自定义指标后,我们选择了通过 Prometheus适配器 从 Prometheus 收集指标。 从那时起,我们的许多客户开始使用Hoizontal Pod Autoscaling,他们中的大多数人只对基本的CPU和内存指标感到满意。
我们一直都知道这不是一个理想的解决方案,我们一直在努力寻求更灵活的解决方案,以便:
- 基于自定义 Prometheus指标 的扩展
- 为更复杂的 Prometheus查询 提供扩展支持
随着我们的开源 Istio operator 的发布以及在 Pipeline平台 上广泛引入基于Istio的 服务网格 ,我们也提供了根据自定义的Istio指标的自动缩放功能。 Prometheus现在提供网络指标,延迟,故障率以及更多指标(默认情况下从Istio中删除)。 我们的 HPA operator 根据这些指标决定是否扩展。
但是,在使用 Prometheus Adapter 时,我们的方法已不再可行,因此我们决定探索替代方案。
如果您错过了我们关于 Pipeline 平台所支持和自动化不同类型的 自动缩放 功能的系列博客,请查看这些早先的帖子:
- Autoscaling Kubernetes集群
- Vertical pod autoscaler
- 自定义指标上的水平自动缩放Kubernetes部署
- Horizontal Pod Autoscaler Kubernetes Operator
- 重新加载水平Pod自动调节器操作员
TL;DR
- Pipeline 及其 HPA Operator 中对重新设计的自定义指标支持的介绍。
- 使用 来自Prometheus的Istio指标 自动调整Spring Boot部署的示例
- 深入了解添加自定义指标后发生了什么
- 切换到另一个 自定义指标适配器 , kube-metrics-adapter 的介绍
重新支持自定义指标
由于上面列出的原因,我们决定使用另一个 自定义指标适配器 , kube-metrics-adapter 。
kube-metrics-adapter是一种通用指标适配器,可以从多个来源收集和提供指标。对于每个源,都有一个 Collector 实现;目前,我们对其 Prometheus 收集器最感兴趣。
Prometheus Collector 是一个通用收集器。它将 Prometheus 查询映射到可由 HPA 控制器用于部署自动扩展的度量标准。它的方法不同于 Prometheus Adapter ,它具有预定义的规则集 - 包含针对 Prometheus 运行的查询,用于将指标转换为自定义指标 - 定期执行。获取所有匹配的指标标准(因为这些查询必须是通用的并且定位所有pod和部署),并作为自定义指标进行转换和公开。相比之下,“Prometheus collector”仅收集自定义查询返回的指标结果,其定义因部署而异,并且仅针对单个部署/ pod或服务,从而减少了存储的指标总数。该解决方案的一个缺点是,目前,用户应该避免执行性能不佳的查询。
使用ISTIO自动伸缩Spring Boot应用
我选择了流行的 spotguides , 基于MySQL的Sprint Boot 应用 ,以便在MySQL服务器旁,快速启动一个轻量级Web应用程序容器。 我使用 Banzai Pipeline Beta ,它支持在六个云提供商中或在本地快速启动Kubernetes集群。 Prometheus & Grafana Monitoring以及Istio是默认功能,可以通过UI开关轻松打开(Pipeline处理其余部分)。 在这个例子中,我将在Google Cloud上启动一个Kubernetes集群,并打开 Monitoring and Service Mesh ,并在其上部署 Spring Boot Spotguide 。 群集创建是我们的 spotguide 向导的一部分,但是,因为 Service Mesh 是 Pipeline 中的一个相对较新的功能,我们不能(迄今为止)从 spotguide 的流程中启用它, 所以我们必须事先创建集群。
我在 这个视频 中记录了这些步骤:
一旦你的Spring Boot 容器 和 MySQL 服务器启动并运行,你就可以从 Spotguid 总览 打开 演示程序 。这是一个演示应用程序,是典型的 Spring Web 应用程序。我们已经创建了一个 GitHub 代码库,你可以在里面找到示意代码(就像我们的其他 spotguides 一样)。默认情况下,应用程序URL将仅返回运行状况检查状态,该状态连接到 Kubernetes 活动和准备情况检查。然后,JVM指标将暴露给 Prometheus ,并且repo将集成到我们的CI/CD流中,因此,一旦您提交业务逻辑,它将自动部署到集群。在 这里 阅读更多关于我们的spotguides。
您可以从群集列表或详细信息页面下载 Kubernetes 配置,以便稍后从本地计算机获取对群集的 kubectl 访问权限。
我正在使用 hey 工具( go get -u github.com/rakyll/hey )来生成针对Spring应用程序的负载;下面的命令将 每秒发出50个请求 ,总计 10000 个请求:
hey -n 10000 -q 50 https://spring-boot-custom-metrics-demo.sancyx5g25.sancyx.beta.banzaicloud.io/actuator/health/kubernetes
现在,打开监控(我们的 Spotguide摘要 或群集详细信息页面中提供的链接)以查看可用的指标并确定您的 Prometheus 查询。 因为我们启用了Service Mesh,所有网络通信都将通过Envoy代理,将指标发送到Istio遥测服务,该服务由 Prometheus 抓取。
我将基于我的示例,查询基于 istio_requests_total 指标,该指标与Spring容器相关:
sum(rate(istio_requests_total{destination_service="spring-boot-custom-metrics-demo-spotguide-spring-boot.default.svc.cluster.local",destination_service_name="spring-boot-custom-metrics-demo-spotguide-spring-boot",destination_service_namespace="default",destination_workload="spring-boot-custom-metrics-demo-spotguide-spring-boot"}[1m]))
请务必添加相应的标签过滤器,以便专门选择与您的pod/部署相关的指标。
从部署列表页面上的 Horizontal Pod Autoscaler 菜单中选择 spring-boot-custom-metrics-demo-spotguide-spring-boot 部署,以访问 HPA Edit 页面。 在那里,您可以通过输入自定义指标或查询的名称来设置cpu,内存和自定义指标。
现在,如果您在更长的时间内生成另一个负载(50个请求/秒),则应在属于部署的HPA中增加副本计数:
hey -n 50000 -q 50 https://spring-boot-custom-metrics-demo.sancyx5g25.sancyx.beta.banzaicloud.io/actuator/health/kubernetes

...

kubectl get hpa

NAME                                                   REFERENCE                                                 TARGETS      MINPODS   MAXPODS   REPLICAS   AGE
spring-boot-custom-metrics-demo-spotguide-spring-boot   Deployment/spring-boot-custom-metrics-demo-spotguide-spring-boot   245866m/40   1         10        7          80s
加载结束后,副本数将慢慢减少到默认的最小值:
kubectl get hpa

NAME                                                   REFERENCE                                                 TARGETS   MINPODS   MAXPODS   REPLICAS   AGE
spring-boot-custom-metrics-demo-spotguide-spring-boot   Deployment/spring-boot-custom-metrics-demo-spotguide-spring-boot   266m/40   1         10        1          32m
背后的场景
让我们深入了解使用Pipeline UI向部署添加自定义指标时幕后发生的情况。 这个流程非常类似于资源指标,您可能会从之前的一系列帖子中熟悉这些指标,但是现在,让我们关注与自定义指标相关的API。
Pipeline UI使用HPA API创建/更新指标:
PUT {{pipeline_url}}/api/v1/orgs/:orgId/clusters/:clusterId/hpa

{
  "scaleTarget": "example-deployment-name",
  "minReplicas": 1,
  "maxReplicas": 10,
  "customMetrics": {
    "customMetricName": {
      "query": "sum({kubernetes_pod_name=~/"^example-deployment-name-pod.*/",__name__=~/"example-metric-name/"})",
      "targetAverageValue": "100"
    }
  }
}
如果要指定绝对值,可以使用 targetValue 而不是 targetAverageValue 。 不同之处在于, targetAverageValue 使用当前pod副本计数对获取的度量值进行平均。
Pipeline 实际上做的是为您的部署添加以下注释:
hpa.autoscaling.banzaicloud.io/maxReplicas=10
    hpa.autoscaling.banzaicloud.io/minReplicas=1
    prometheus.customMetricName.hpa.autoscaling.banzaicloud.io/query=sum({kubernetes_pod_name=~/"^example-deployment-name-pod.*/",__name__=~/"example-metric-name/"})
所有这些都是通过 HPA operator 实现的,它根据部署注释管理HPA资源。 Pipeline 在群集创建完成后,通过一个post hook,部署 HPA operator ,然后,如果 metrics.api 尚未注册,则部署 kube-metrics-adapter 和 metrics-server 。 此过程可能会有所不同,具体取决于您的云提供商和K8s版本,这些版本可能已安装了某些功能。在我们的例子中,新创建的HPA对象将如下所示:
apiVersion: v1
items:
- apiVersion: autoscaling/v1
  kind: HorizontalPodAutoscaler
  metadata:
    annotations:
    ...
      autoscaling.alpha.kubernetes.io/current-metrics: '[{"type":"Object","object":{"target":{"kind":"Pod","name":"example-deployment-name-customMetricName","apiVersion":"v1"},"metricName":"customMetricName","currentValue":"222m"}}]'
      autoscaling.alpha.kubernetes.io/metrics: '[{"type":"Object","object":{"target":{"kind":"Pod","name":"example-deployment-name-customMetricName","apiVersion":"v1"},"metricName":"customMetricName","targetValue":"40"}}]'
      metric-config.object.customMetricName.prometheus/per-replica: "true"
      metric-config.object.customMetricName.prometheus/query: sum({kubernetes_pod_name=~/"^example-deployment-name-pod.*/",__name__=~/"example-metric-name/"})
    ...
  spec:
    maxReplicas: 10
    minReplicas: 1
    scaleTargetRef:
      apiVersion: apps/v1
      kind: Deployment
      name: example-deployment-name
  status:
    currentReplicas: 1
    desiredReplicas: 1
kind: List
metadata:
  resourceVersion: ""
  selfLink: ""
请注意,自定义度量标准是 Object 类型,并绑定到名为 example-deployment-name-customMetricName 的Pod资源。 Kube-metrics-adapter 也使用注释查询来获取度量值,该值在以下端点公开 /apis/custom.metrics.k8s.io/v1beta1/namespaces/default/pods/example-deployment-name -customMetricName/customMetricName ,并且它正是HPA控制器将要查找的位置:
$ kubectl get --raw "/apis/custom.metrics.k8s.io/v1beta1/namespaces/default/pods/*/customMetricName" | jq .
{
  "kind": "MetricValueList",
  "apiVersion": "custom.metrics.k8s.io/v1beta1",
  "metadata": {
    "selfLink": "/apis/custom.metrics.k8s.io/v1beta1/namespaces/default/pods/%2A/customMetricName"
  },
  "items": [
    {
      "describedObject": {
        "kind": "Pod",
        "namespace": "default",
        "name": "example-deployment-name-customMetricName",
        "apiVersion": "v1"
      },
      "metricName": "customMetricName",
      "timestamp": "2019-03-13T20:23:32Z",
      "value": "222m"
    }
  ]
}
很高兴你阅读本文,希望你有一个关于 自动缩放 愉快的实践体验!

关于 ServiceMeshe 社区
ServiceMesher 社区是由一群拥有相同价值观和理念的志愿者们共同发起,于 2018 年 4 月正式成立。
社区关注领域有:容器、微服务、Service Mesh、Serverless,拥抱开源和云原生,致力于推动 Service Mesh 在中国的蓬勃发展。

社区官网: https://www.servicemesher.com
正文到此结束
- 本文标签: 安装 代码 list 博客 Pods 自动化 GitHub value 删除 Spring Boot 服务器 sql Google google cloud http id web 集群 API Kubernetes src 希望 2019 spring tar 管理 App example IO 部署 云 https IDE CTO Uber Service 微服务 mysql git UI 注释 开源 下载 适配器 ip 配置 时间 快的 ACE JVM
- 版权声明: 本文为互联网转载文章,出处已在文章中说明(部分除外)。如果侵权,请联系本站长删除,谢谢。
- 本文海报: 生成海报一 生成海报二
热门推荐


相关文章


Loading...
![[HBLOG]公众号](http://www.liuhaihua.cn/img/qrcode_gzh.jpg)

