Spring Boot Actuator 整合 Prometheus
简介
Spring Boot 自带监控功能 Actuator,可以帮助实现对程序内部运行情况监控,比如监控状况、Bean加载情况、环境变量、日志信息、线程信息等。这一节结合 Prometheus 、Grafana 来更加直观的展示这些信息。
实验
说明
| 服务名 | 地址 | 端口 |
|---|---|---|
| Prometheus | 172.16.2.101 | 9090 |
| Grafana | 172.16.2.101 | 3000 |
| Spring Boot Demo | 172.16.2.204 | 8080 |
创建项目
创建用于测试的 Spring Boot 项目,主要代码如下。
pom.xml
<dependency>
    <groupId>org.springframework.boot</groupId>
    <artifactId>spring-boot-starter-actuator</artifactId>
</dependency>
<dependency>
    <groupId>org.springframework.boot</groupId>
    <artifactId>spring-boot-starter-web</artifactId>
</dependency>
<dependency>
    <groupId>io.micrometer</groupId>
    <artifactId>micrometer-registry-prometheus</artifactId>
</dependency>

<dependency>
    <groupId>org.springframework.boot</groupId>
    <artifactId>spring-boot-starter-test</artifactId>
    <scope>test</scope>
</dependency>
application.yml
management:
  endpoints:
    web:
      exposure:
        include: '*'

  endpoint:
    health:
      show-details: always

  metrics:
    tags:
      application: actuator-demo
- management.endpoints.web.exposure.include:大多数actuator的端口都不会通过http公开,* 代表公开所有这些端点。对于生产环境,应该仔细选择要公开的端点。
- management.metrics.tags.application:为应用设置 tag ,方便区分不同的应用。
启动类
@SpringBootApplication
@RestController
public class SpringbootActuatorPrometheusDemoApplication {

    public static void main(String[] args) {
        SpringApplication.run(SpringbootActuatorPrometheusDemoApplication.class, args);
    }

    @RequestMapping(value = "/hello")
    public String  sayHello() {
        for (int i = 1 ; i <= 10 ; i++) {
            Thread t = new Thread(() -> {
                try {
                    Thread.sleep(5000);
                } catch (InterruptedException e) {
                    e.printStackTrace();
                }
            } , "HelloThread - " + i);
            t.start();
        }
        return "ok";
    }

    /**
    @Bean
    MeterRegistryCustomizer<MeterRegistry> metricsCommonTags() {
        return registry -> registry.config().commonTags("application", "springboot-actuator-prometheus-demo");
    }
    */

}
配置 Prometheus 和 Grafana
在 prometheus.yml 中添加针对该 Spring Boot 应用 的监控 job
- job_name: 'actuator-demo'
    metrics_path: '/prometheus'
    static_configs:
    - targets: ['172.16.2.204:8080']
运行 Prometheus 和 Grafana:
docker start prometheus grafana
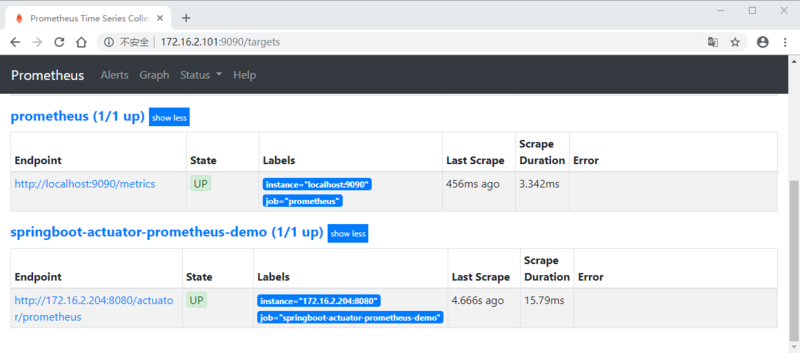
访问 Prometheus UI http://172.16.2.101 :9090 ,查看 targets ,可以看到 job 处于 UP 状态,说明配置成功了。
Grafana UI http://172.16.2.101 :3000,通过Grafana的 + 图标导入(Import) JVM (Micrometer) dashboard:
- grafana id = 4701
- 注意选中prometheus数据源
查看JVM (Micormeter) dashboard:
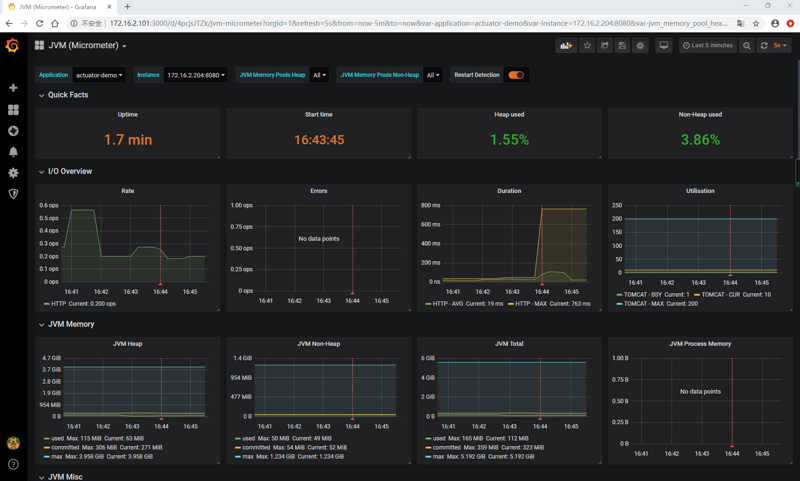
可以看到应用的 JVM 的 堆栈、 线程、 IO 等等信息。
参考
https://micrometer.io/docs/re...
https://prometheus.io/docs/pr...往期内容
正文到此结束
热门推荐


相关文章

近期评论
-
你这基本没有更新呀,最近文章显示还是2019年的文章。不符合要求哈
-
关键词:慕云博客 链接:https://www.lilun.me 描述:分享原创文字的个人博客
-
-
-
可以提供一下源码吗
-
不是商业站,鸡娃学习笔记
-
-
-
-
听他们说很厉害的样子
Loading...
![[HBLOG]公众号](http://www.liuhaihua.cn/img/qrcode_gzh.jpg)

