使用 Prometheus & Grafana 监控你的 Spring Boot 应用
准备工作
v2.14.0
v6.5.0
使用 Docker 部署上面的基础环境,配置文件可见,输入以下命令进行一键部署:
# 检查配置
docker-compose config
# 启动服务(-d 后台启动)
docker-compose up -d
# 停止并清除服务
docker-compose down
添加依赖项
pom.xml
<dependencies>
  <dependency>
    <groupId>org.springframework.boot</groupId>
    <artifactId>spring-boot-starter-actuator</artifactId>
  </dependency>

  <!-- 借助 Micrometer 对接 Prometheus 监控系统 -->
  <dependency>
    <groupId>io.micrometer</groupId>
    <artifactId>micrometer-registry-prometheus</artifactId>
  </dependency>
</dependencies>
application.yml
spring:
  application:
    name: monitoring-prometheus-grafana

management:
  endpoints:
    web:
      exposure:
        # 将 Actuator 的 /actuator/prometheus 端点暴露出来
        include: 'prometheus'
  metrics:
    tags:
      application: ${spring.application.name}

logging:
  level:
    io.github.y0ngb1n.*: debug
使用方式
Step 1: 启动服务
$ mvn spring-boot:run
...
2019-12-08 22:28:11.916  INFO 36157 --- [           main] o.s.b.a.e.web.EndpointLinksResolver      : Exposing 1 endpoint(s) beneath base path '/actuator'
2019-12-08 22:28:12.045  INFO 36157 --- [           main] o.s.b.w.embedded.tomcat.TomcatWebServer  : Tomcat started on port(s): 8080 (http) with context path ''
2019-12-08 22:28:12.050  INFO 36157 --- [           main] i.g.y.m.p.PrometheusGrafanaApplication   : Started PrometheusGrafanaApplication in 20.638 seconds (JVM running for 27.154)
Step 2: 访问 /actuator/prometheus
端口
$ curl -sS http://127.0.0.1:8080/actuator/prometheus
# HELP jvm_gc_memory_promoted_bytes_total Count of positive increases in the size of the old generation memory pool before GC to after GC
# TYPE jvm_gc_memory_promoted_bytes_total counter
jvm_gc_memory_promoted_bytes_total{application="monitoring-prometheus-grafana",} 9986992.0
# HELP jvm_threads_daemon_threads The current number of live daemon threads
# TYPE jvm_threads_daemon_threads gauge
jvm_threads_daemon_threads{application="monitoring-prometheus-grafana",} 30.0
# HELP process_uptime_seconds The uptime of the Java virtual machine
# TYPE process_uptime_seconds gauge
process_uptime_seconds{application="monitoring-prometheus-grafana",} 75.133
...
将应用与 Prometheus 对接
添加 Prometheus 的配置文件:
scrape_configs:
  # 任意写,建议英文,不要包含特殊字符
  - job_name: 'spring-boot-app'
    # 多久采集一次数据
    scrape_interval: 15s
    # 采集时的超时时间
    scrape_timeout: 10s
    # 采集的路径是啥
    metrics_path: '/actuator/prometheus'
    # 采集服务的地址,设置成 Spring Boot 应用所在服务器的具体地址
    static_configs:
      - targets: ['192.168.31.44:8080']
可使用 ifconfig
查看宿主机的 IP 地址,Prometheus 服务器就会自动每隔15秒请求 http://your-ip:8080/actuator/prometheus
。更多配置参见 :point_right: 官方文档
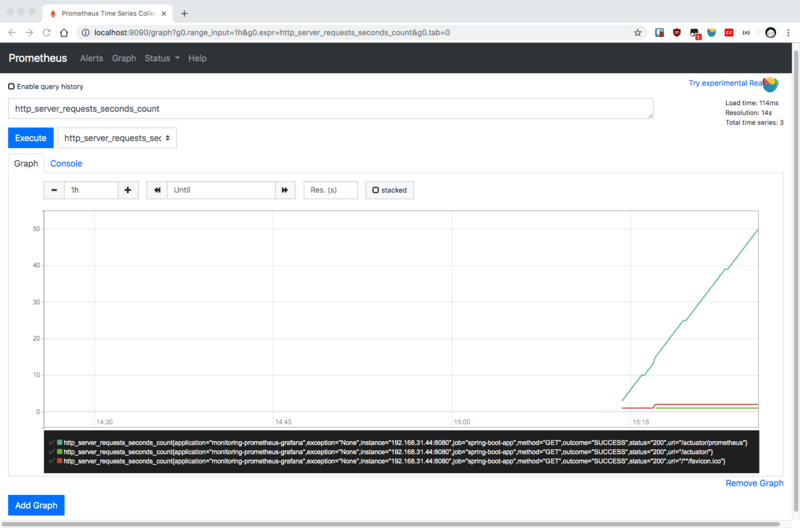
测试访问 Prometheus
STEP 1:在浏览器中访问 http://localhost:9090

STEP 2:查看监控数据
Insert metric at cursor
Graph
Execute
集成 Grafana 可视化
前面已经使用 docker-compose
启动了 Grafana,下面进行配置。
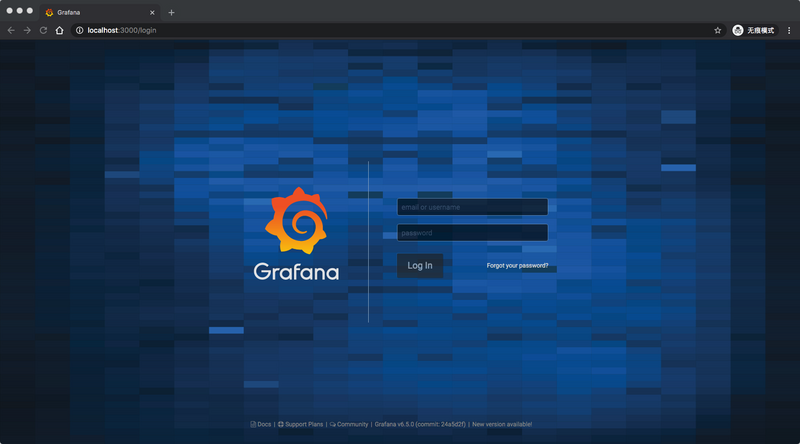
STEP 1:在浏览器中访问 http://localhost:3000
,并使用初始帐号 admin:admin
进行登录
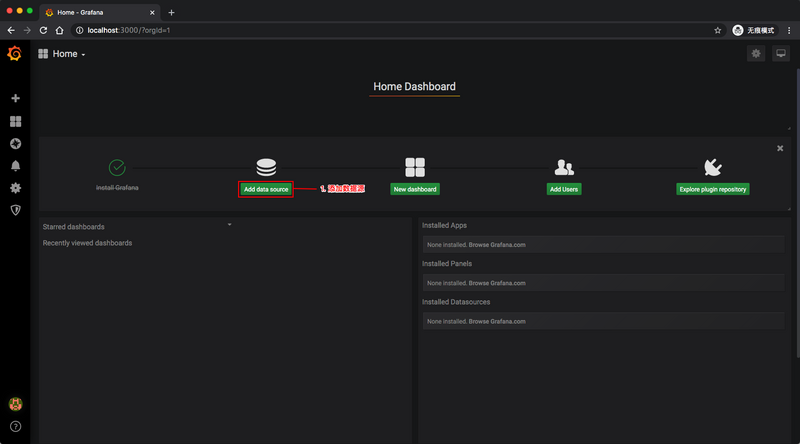
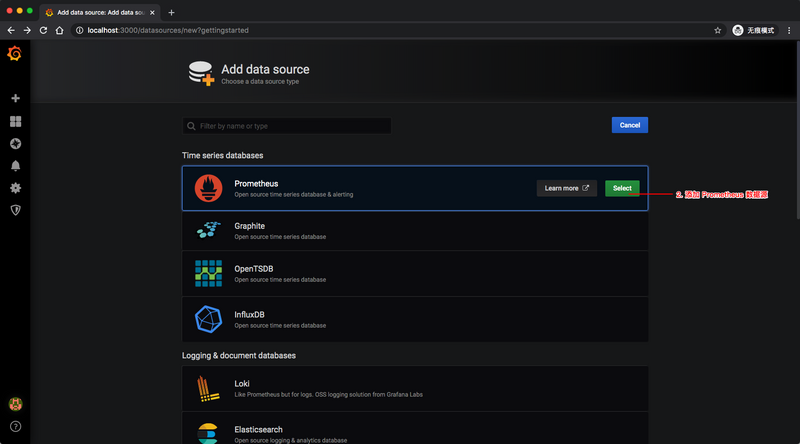
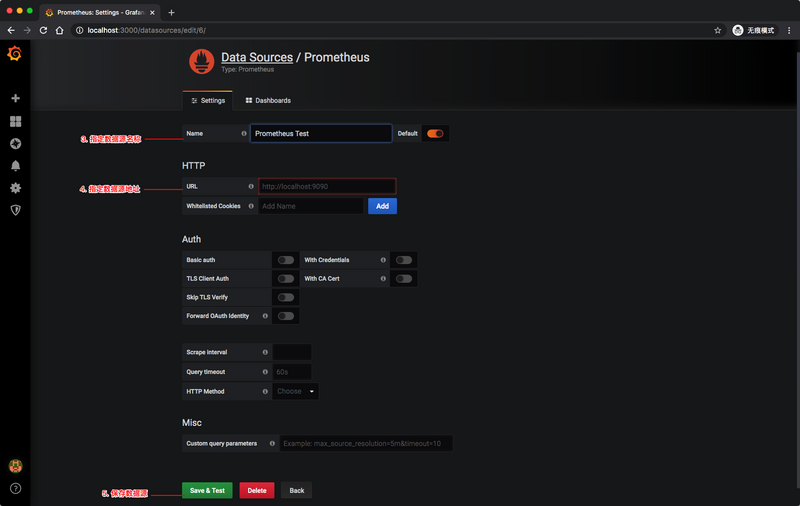
STEP 2:点击 Add Data Source
进行添加 Prometheus 数据源
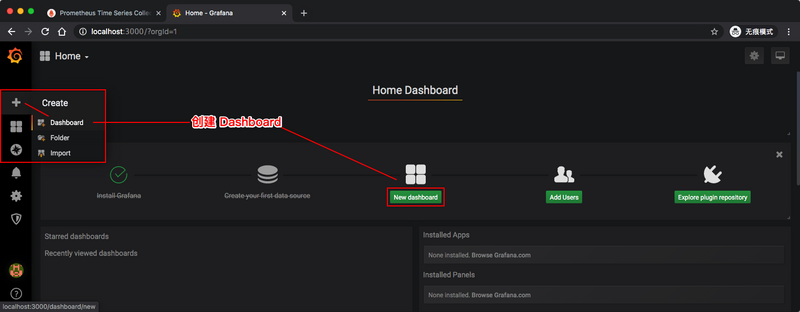
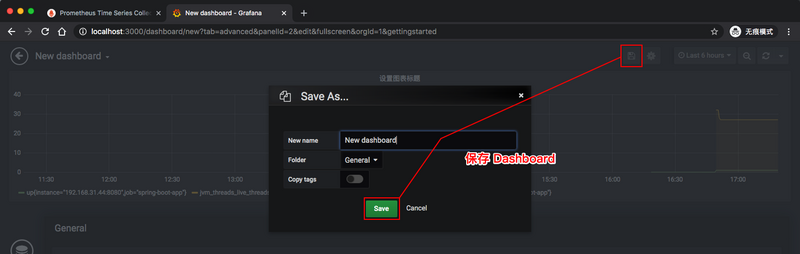
STEP 3:创建 Dashboard
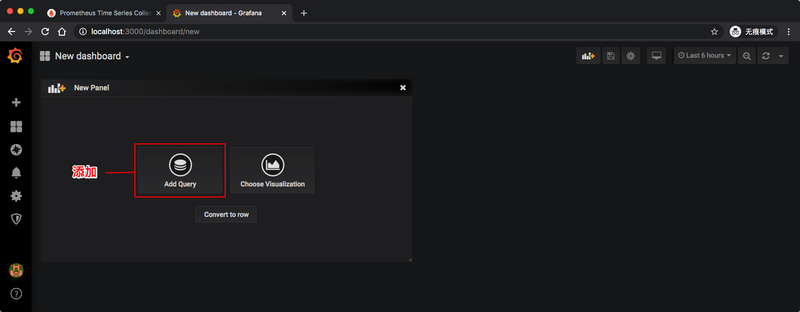
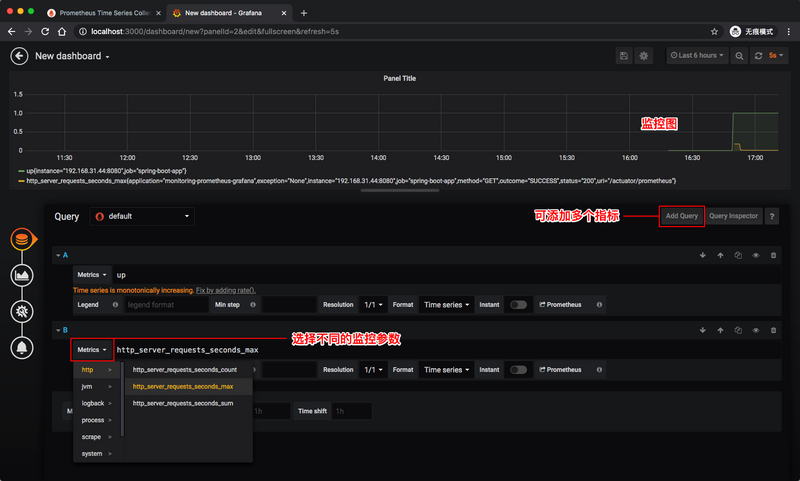
- 设置监控指标
- 设置 Dashboard 信息
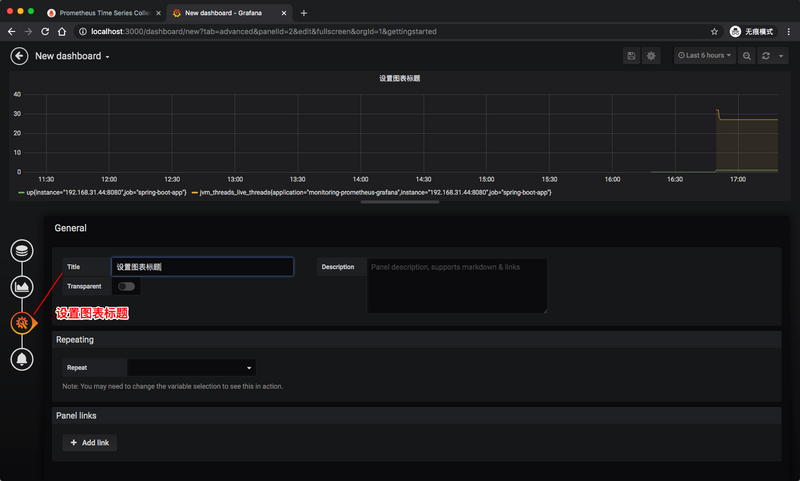
- 保存 Dashboard
可以添加不同的指标,指标的取值详见 Spring Boot 应用的 /actuator/prometheus
端点。重复以上步骤操作,即可为 Dashboard 添加新的图表。
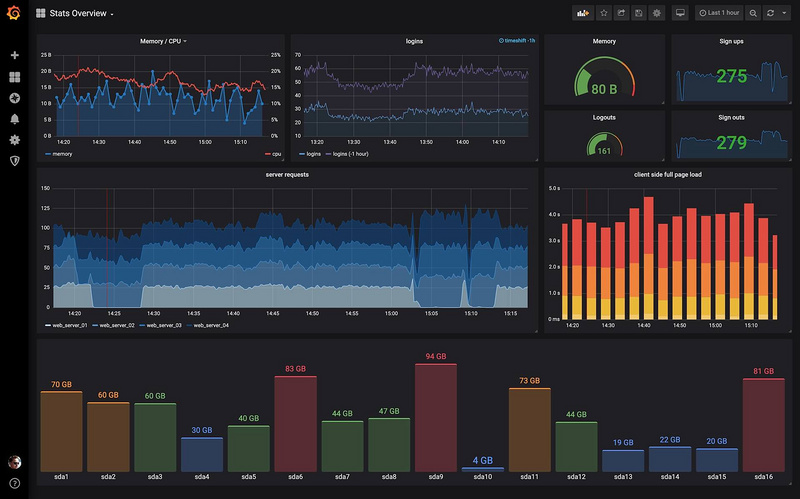
如果你觉得自己定制一个 Dashboard 过于复杂了,那你可以逛一下 Grafana 的 Dashboard 市场 ( https://grafana.com/grafana/d... ),这样就可以方便快捷地复用别人精美的 Dashboard 面板了。
参考资料
- https://www.callicoder.com/sp...
- http://www.itmuch.com/spring-... ,by 周立
- https://www.baeldung.com/spri...
- https://yunlzheng.gitbook.io/...
- https://micrometer.io/docs/re...
- https://prometheus.io/docs/in...
- https://hub.docker.com/r/prom...
- https://grafana.com/docs/graf...
感谢您的阅读,本文由 杨斌的博客 版权所有。
如若转载,请注明出处:杨斌的博客( https://y0ngb1n.github.io?utm... )
项目已托管于 GitHub: y0ngb1n/spring-boot-samples ,欢迎 Star, Fork :kissing_heart:
正文到此结束
热门推荐


相关文章


Loading...
![[HBLOG]公众号](http://www.liuhaihua.cn/img/qrcode_gzh.jpg)

