java kubernetes client 获取 集群 metrics信息 原 荐
K8S client 获取资源利用率和 metrics 信息
获取与展示 POD 级甚至 Container 级的资源利用率是很常见的发布系统需求,然而网上并没有什么资料告诉大家怎么做,本文将告诉大家原理以及 java 代码实践。
命令行获取
其实 kubectl 是可以获取到 node、pod、container 三个级别的资源利用率情况的,只不过大家可能不了解。
[root@10-42-74-90 ~]# kubectl top nodes
NAME            CPU(cores)   CPU%   MEMORY(bytes)   MEMORY%
10.42.187.205   1691m        5%     14876Mi         24%
10.42.37.63     513m         6%     12994Mi         92%
10.42.8.102     231m         2%     8124Mi          57%
利用 top 获取了节点级别的资源利用率。
[root@10-42-74-90 ~]# kubectl top pods redis-master-fsx46
NAME                 CPU(cores)   MEMORY(bytes)
redis-master-fsx46   1m           14Mi
获取 default 命名空间下,redis-master-fsx46 这个 POD 的资源利用率。
[root@10-42-74-90 ~]# kubectl top pods redis-master-fsx46 --containers
POD                  NAME     CPU(cores)   MEMORY(bytes)
redis-master-fsx46   master   1m           14Mi
甚至打印出具体每个 container 的资源利用情况(这个 POD 只有 1 个 container 叫做 master)。
[root@10-42-74-90 ~]# kubectl top pods -l name=redis-master
NAME                 CPU(cores)   MEMORY(bytes)
redis-master-fsx46   2m           14Mi
还能按标签筛选 pods。
原理说明
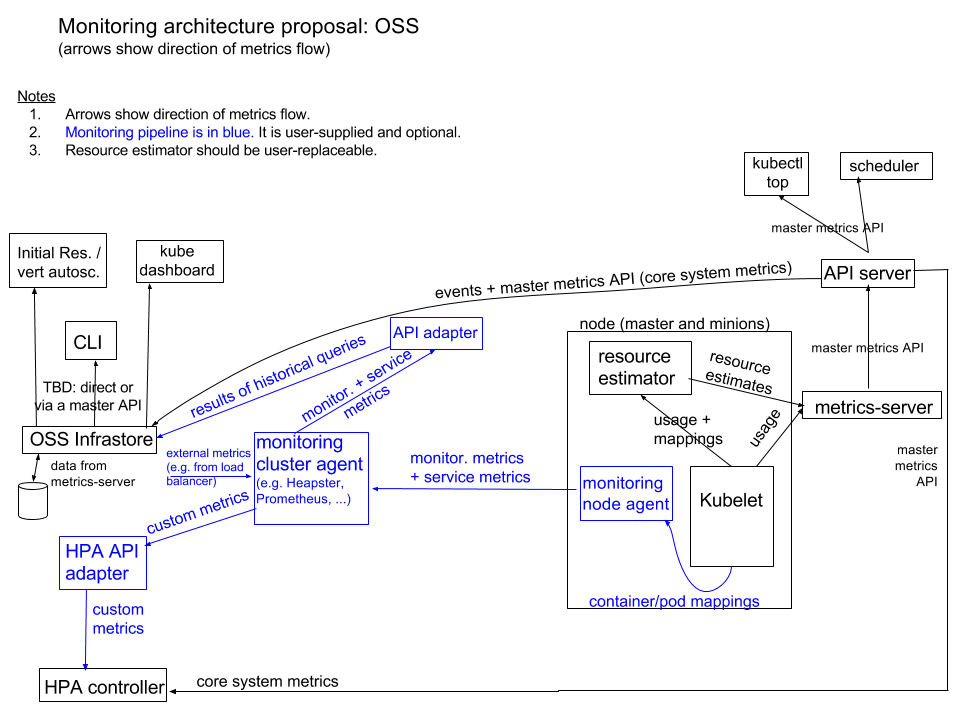
其实目前新版的 K8S 在监控这块的架构已经非常明确了,只不过国内很少有文章解释这一块,其官方架构说明见: https://github.com/kubernetes/community/blob/master/contributors/design-proposals/instrumentation/monitoring_architecture.md 。其架构分位 2 个部分:
- 内置于 K8S 的核心指标采集,安装 K8S 就自带了(下图黑色部分)。
- 第三方的监控采集方案,需要大家自己选型,比如 prometheus 等(下图蓝色部分)。
像 kubectl top 获取的 cpu/mem 使用情况,就属于 K8S 内置的核心指标采集而来,完全不需要第三方的支持。
大家可能听过下面几个监控相关的东西:
- cadvisor
- kube-state-metrics
- metrics-server
- heapster
- prometheus
不知道到底它们是什么关系,到底要用哪个。我简单给它们分分类,帮助大家清楚它们的定位:
- 非 K8S 内置(第三方):
- cadvisor:每个 node 部署 1 个,独立程序,用于采集 dockerd 容器信息,暴露 prometheus 格式接口供采集。
- kube-state-metrics:集群级,监听 K8S 资源变化,暴露 prometheus 格式接口供采集。
- prometheus:采集器,其数据源可以是 cadvisor/kube-state-metrics 或者 k8s 内置的数据源。
- K8S 内置(官方方案):
- kubelet:每个 node 部署 1 个,其内置了部分 cadvisor 功能,因此它也知道所有容器监控信息,也对外提供 prometheus 格式的采集接口。
- metrics-server:集群级,它采集 kubelet 最新资源利用率数据到内存,不保存历史,并且通过 API Server 开放对外 Restful 资源接口获取 JSON 格式的实时 metrics 数据,可以按 node/pod/container 级别查看资源利用率信息。
- heapster:其实就是 metrics-server 的前身,作用基本类似,不过已经被 metrics-server 彻底取代,其官网有如下说明,也就是说基本的 CPU/memory 监控已经被 metrics-server 取代:
- RETIRED: Heapster is now retired. See the deprecation timeline for more information on support. We will not be making changes to Heapster.
- The following are potential migration paths for Heapster functionality:
- For basic CPU/memory HPA metrics: Use metrics-server .
> 如果大家理解上述内容的话就会知道,我们只需要确保 metrics-server 运行在 K8S 集群中,那么就可以通过 API server 得到所有资源利用率情况,这也是 kubectl top 的工作原理。
与 metrics-server 通讯
那么当前,metrics-server 在 API SERVER 注册的 GROUP 叫做 metrics.k8s.io,VERSION 是 v1beta1,所以其对应的 Restful 资源 URI 就是以: /apis/metrics.k8s.io/v1beta1/ 为前缀的。
metrics-server 官方已经说明了其资源 URI 的几种形式: https://github.com/kubernetes/community/blob/master/contributors/design-proposals/instrumentation/resource-metrics-api.md 。
The list of supported endpoints:
-
/nodes– all node metrics; type[]NodeMetrics -
/nodes/{node}– metrics for a specified node; typeNodeMetrics -
/namespaces/{namespace}/pods– all pod metrics within namespace with support forall-namespaces; type[]PodMetrics -
/namespaces/{namespace}/pods/{pod}– metrics for a specified pod; typePodMetrics
The following query parameters are supported:
-
labelSelector– restrict the list of returned objects by labels (list endpoints only)
所以,为了获取某个 namespace 下面的 pods 的资源利用率,我们可以有 2 种方式:
/apis/metrics.k8s.io/v1beta1/namespaces/{namespace}/pods?labelSelector=xxxx
/apis/metrics.k8s.io/v1beta1/namespaces/{namespace}/pods/{pod}
***下面先教大家如何在命令行下按 HTTP 调用 URL 的获取资源信息。***首先启动一个 proxy,它会帮我们解决和 API SERVER 之间的认证问题,我们只需要关注于接口参数即可:然后我们请求 localhost:8888 就可以免认证的调用到 API SERVER 了:会得到 nodes 级的资源利用率:
{
  "kind": "NodeMetricsList",
  "apiVersion": "metrics.k8s.io/v1beta1",
  "metadata": {
    "selfLink": "/apis/metrics.k8s.io/v1beta1/nodes"
  },
  "items": [
    {
      "metadata": {
        "name": "10.42.8.102",
        "selfLink": "/apis/metrics.k8s.io/v1beta1/nodes/10.42.8.102",
        "creationTimestamp": "2019-11-26T06:23:17Z"
      },
      "timestamp": "2019-11-26T06:22:21Z",
      "window": "30s",
      "usage": {
        "cpu": "250264852n",
        "memory": "8318172Ki"
      }
    },
    {
      "metadata": {
        "name": "10.42.37.63",
        "selfLink": "/apis/metrics.k8s.io/v1beta1/nodes/10.42.37.63",
        "creationTimestamp": "2019-11-26T06:23:17Z"
      },
      "timestamp": "2019-11-26T06:22:27Z",
      "window": "30s",
      "usage": {
        "cpu": "551516196n",
        "memory": "13280692Ki"
      }
    },
    {
      "metadata": {
        "name": "10.42.187.205",
        "selfLink": "/apis/metrics.k8s.io/v1beta1/nodes/10.42.187.205",
        "creationTimestamp": "2019-11-26T06:23:17Z"
      },
      "timestamp": "2019-11-26T06:22:20Z",
      "window": "30s",
      "usage": {
        "cpu": "1630534153n",
        "memory": "15209140Ki"
      }
    }
  ]
}
```获取POD级只需要调整URI:


```bash
[root@10-42-74-90 ~]# curl localhost:8888/apis/metrics.k8s.io/v1beta1/namespaces/default/pods/redis-master-fsx46
{
  "kind": "PodMetrics",
  "apiVersion": "metrics.k8s.io/v1beta1",
  "metadata": {
    "name": "redis-master-fsx46",
    "namespace": "default",
    "selfLink": "/apis/metrics.k8s.io/v1beta1/namespaces/default/pods/redis-master-fsx46",
    "creationTimestamp": "2019-11-26T06:24:40Z"
  },
  "timestamp": "2019-11-26T06:24:16Z",
  "window": "30s",
  "containers": [
    {
      "name": "master",
      "usage": {
        "cpu": "969654n",
        "memory": "15012Ki"
      }
    }
  ]
}
kubernetes 资源描述
是不是很简单?但是 cpu 里面为什么有个字母 n?memory 里面为什么有一个 Ki?到底是啥意思?
cpu
请参考官方文档: https://kubernetes.io/zh/docs/concepts/configuration/manage-compute-resources-container/#cpu-的含义
kubernetes 中,CPU 资源的限制和请求以 cpu 为单位, metric 中也以此为单位。
Kubernetes 中的一个 cpu 等于:
- 1 AWS vCPU
- 1 GCP Core
- 1 Azure vCore
- 1 Hyperthread 在带有超线程的裸机 Intel 处理器上
- 1 processor 在物理机上部署的 kubernetes,表示一个逻辑处理器
允许浮点数请求。具有 spec.containers[].resources.requests.cpu 为 0.5 的容器保证了一半 CPU 要求 1 CPU 的一半。表达式 0.1 等价于表达式 100m ,可以看作 “100 millicpu”。同理,100m 等于 100 * 1000n cpu, 即 100000n cpu ,可读作 100000 纳 cpu, n 是 cpu 的最小计量单位。
具有小数点(如 0.1 )的请求由 API 转换为 100m ,精度不超过 1m 。因此,可能会优先选择 100m 的形式。
内存
内存的限制和请求以字节为单位。您可以使用以下后缀之一作为 平均整数或定点整数 表示内存:E,P,T,G,M,K( 非精确值 )。您还可以使用两个字母的等效的幂数:Ei,Pi,Ti ,Gi,Mi,Ki( 精确值 )。例如,以下代表大致相同的值:
128974848, 129e6, 129M, 123Mi(123*1024*1024)
kubernetes client 获取 metrics 信息
kubernetes 得 部署了 metrics 组件, 这样在使用 kubectl get --raw "/openapi/v2" 可获取到 metrics api 的 openapi 说明。
可以通过 openapi-generator-cli,重新生成 kubernetes client 。官方的 client 库,也是这样自动生成的,官方的 kubernetes client 生成工具位于: https://github.com/kubernetes-client/gen。
该工具的核心逻辑:
- 配置一系列的参数,使用
./java.sh out settings运行生成 java 客户端, 其中out是输出目录,settings是脚本需要的环境变量配置文件。; - 运行
preprocess_spec.py从 kubernetes 官方仓库获取 swagger api 文档,并将同目录的custom_objects_spec.json文件合并到swagger.json文件中。 - 运行 swagger generate 生成对应的程序语言 client 文件。
生成后,只需要使用 maven/gradle 编译打包即可。
官方 kubenetes client 中缺少了 metrics 相关的 api, 我们可以在 custom_objects_spec.json 中添加上 metrics 相关的 api 描述信息,加入即可( api + Model 定义 )。然后执行编译。
此过程中如果 Model 不全,可能会造成 编译 kubernetes client 时,出现如下类似的错误:
[ERROR] /Users/guangfuhe/Projects/java/wde/k8sclient/src/test/java/io/kubernetes/client/model/IoK8sApiCoreV1NodeStatusTest.java:[25,34] 找不到符号
  符号:   类 IoK8sApiCoreV1NodeConfigStatus
  位置: 程序包 io.kubernetes.client.model
上面的缺失类是 Model 中缺少了定义造成的,可以在自己的集群 openapi 文档中查找 Model。
依据集群的 openapi 文档,自动生成 kubernetes client 的方法和详细步骤如下:
- 获取集群的 openapi 文档,
kubectl get --raw "/openapi/v2"> k8s-client-swagger.json - 在 kubernetes-client/gen 项目中
openapi/custom_objects_spec.json, 插入自定义的 api 接口描述和 model 描述信息,此时需要注意 custom_objects_spec.json 文件的 json 格式 。 - kubernetes-client/gen 项目,会在
preprocess_spec.py中将openapi/custom_objects_spec.json自动合并到 kubernetes 官方 openapi 文档中。 - 运行 kubernetes-client/gen 需要
setting文件,详情看“我的 settings 文件配置“。 - 运行。在 kubernetes-client/gen 中的
openapi/目录下,运行sh java.sh out settings。自动生成的 kubernetes client 会放在out目录下。此过程会生成 docker 镜像,并使用 docker 镜像完成 api 生成。 - 编译还需要
io.kubernetes.fluent和 io.kubernetes.custom两个 package, 可以通过原来的io.kubernetes:client-java:6.0.1中获取源代码, 然后从源代码提取 custom 和 fluent package。 - 由于处理 Model 比较繁琐,处理完上述问题后,还有 n 个 test Model, 由于不影响功能,我直接取消了 test 类的生成(生成后直接删除了,就不需要处理某些单元测试类找不到的问题)。
- 生成后,使用 maven 或者 gradle 编译,我使用的是 maven。
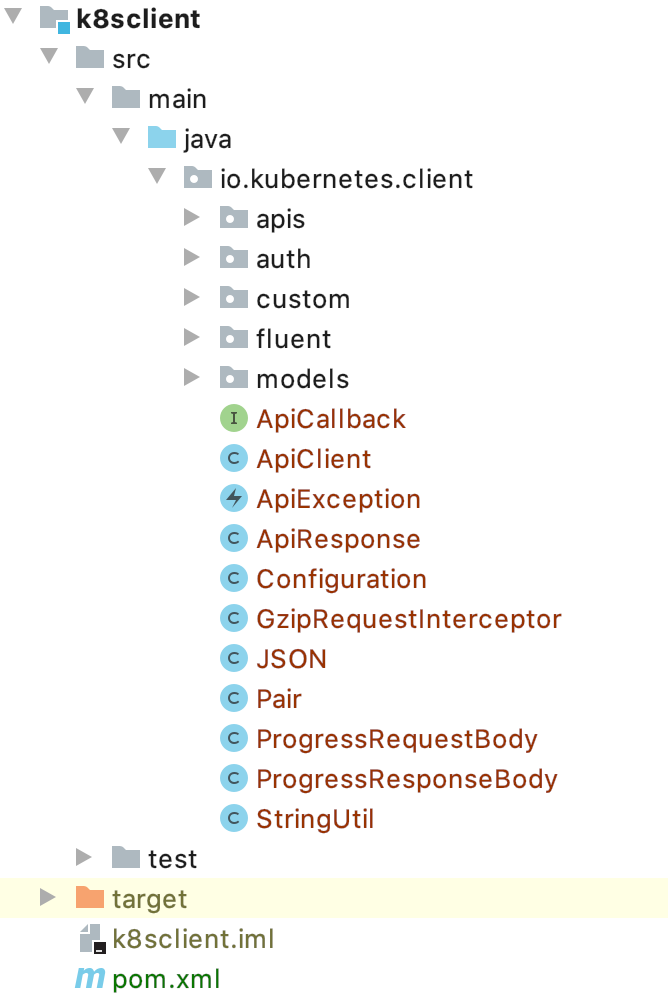
mvn clean compile package -DskipTests
最终的目录结构如图:
我的kubernetes gen配置
KUBERNETES_BRANCH=master
CLIENT_VERSION=6.1.0
PACKAGE_NAME=io.kubernetes.client
生成 k8s 本地集群的 api 文档描述文件(openapi), kubectl get --raw "/openapi/v2"> k8s-client-swagger.json
我的 custom_object_spec.json 如下, github gist 地址: https://gist.github.com/hgfkeep/9e65f5fb8f583f81fd4c8dc653793028:
[custom_objects_spec.json (114KB)]
可能出现的问题
编译过程可能缺少依赖
<dependency>
    <groupid>io.sundr</groupid>
    <artifactid>builder-annotations</artifactid>
    <version>0.2.1</version>
    <exclusions>
        <exclusion>
            <groupid>com.sun</groupid>
               <artifactid>tools</artifactid>
            </exclusion>
         </exclusions>
</dependency>
但是 builder-annotations 强依赖 com.sun.tools.jar , 对于高版本的 jdk 来说,可以直接 exclude 掉。
java doc 问题
可能会出现类似如下的错误, 该错误是生成 java doc 时,提示的。可能是我用的 jdk 比较新:
[ERROR] /Users/guangfuhe/Projects/java/wde/k8sclient/src/main/java/io/kubernetes/client/apis/AdmissionregistrationV1beta1Api.java:1323: 错误: 属性在 HTML5 中不受支持: summary
[ERROR]      <table summary="Response Details" border="1">
[ERROR]
我通过 pom.xml 注释掉 maven-javadoc-plugin 插件,关闭了 doc 生成,就可以成功编译了。
单个 java 文件过大导致类存在却飘红
java 单个文件过大,导致 idea code insight 特效无法生效,可以直接清理自动生成的注释信息(使用 IDEA 替换功能,快速清理),清理的信息如下:
</table><table summary="Response Details" border="1">
        <tbody><tr><td> Status Code </td><td> Description </td><td> Response Headers </td></tr>
        <tr><td> 200 </td><td> OK </td><td>  -  </td></tr>
        <tr><td> 401 </td><td> Unauthorized </td><td>  -  </td></tr>
     </tbody></table>
将 CoreV1Api.java 中的上述信息清理后即可。
使用 custom kubernetes java client
pom.xml 配置,需要引入之前生成的客户端:
<dependency>
    <groupid>cn.ac.ict.wde</groupid>
    <artifactid>k8sclient</artifactid>
    <version>0.0.1-SNAPSHOT</version>
</dependency>
获取 node metrics 信息
核心代码如下:
// 初始化时,根据配置的kube config 文件路径, 获取api client
public void init() {
    try (InputStreamReader in = new InputStreamReader(new ClassPathResource(config.getKubeconfigFilePath()).getInputStream())) {
        KubeConfig kubeconfig = KubeConfig.loadKubeConfig(in);
        this.apiClient = ClientBuilder.kubeconfig(kubeconfig).build();
    } catch (IOException e) {
        log.error("create kubernetes api client error! {}", e);
    }
}

// 打印node metrics信息
public void printNodeMetrics() throws ApiException {
    checkApiClient();
    MetricsV1beta1Api metricsV1beta1Api = new MetricsV1beta1Api(this.apiClient);
    V1beta1NodeMetricsList nodeMetricsList = metricsV1beta1Api.listNodeMetrics(null, null, null, 100, null, null, 3000, false);
    if (nodeMetricsList != null) {
        for (V1beta1NodeMetrics nodeMetrics : nodeMetricsList.getItems()) {
            log.debug("node {}: {}", nodeMetrics.getMetadata().getName(), nodeMetrics.getUsage());
        }
    }
}


// 打印 namespce 中pod 里面的 每个 container metrics 信息
public void printNamespacePodMetrics(String namespace) throws ApiException {
    checkApiClient();
    MetricsV1beta1Api metricsV1beta1Api = new MetricsV1beta1Api(this.apiClient);
    V1beta1PodMetricsList nodeMetricsList = metricsV1beta1Api.listNamespacedPodMetrics(namespace, null, null, null, 100, null, null, 3000, false);
    if (nodeMetricsList != null) {
        for (V1beta1PodMetrics podMetrics : nodeMetricsList.getItems()) {
            for (V1beta1ContainerMetrics containerMetrics : podMetrics.getContainers()) {
                log.debug("container {}: {}", containerMetrics.getName(), containerMetrics.getUsage());
            }
        }
    }
}
NodeMetrics 输出信息如下:
16:35:44.911 [main] DEBUG cn.ac.ict.wde.service.KubernetesService - node ***15: {cpu=Quantity{number=0.828512394, format=DECIMAL_SI}, memory=Quantity{number=108825636864, format=BINARY_SI}}
16:35:44.915 [main] DEBUG cn.ac.ict.wde.service.KubernetesService - node ***17: {cpu=Quantity{number=0.328837919, format=DECIMAL_SI}, memory=Quantity{number=25566048256, format=BINARY_SI}}
ContainerMetrics 信息如下:
16:44:28.536 [main] DEBUG cn.ac.ict.wde.service.KubernetesService - container prometheus-demo-app: {cpu=Quantity{number=0.000912205, format=DECIMAL_SI}, memory=Quantity{number=42446848, format=BINARY_SI}}
16:44:28.543 [main] DEBUG cn.ac.ict.wde.service.KubernetesService - container hello: {cpu=Quantity{number=0.000107881, format=DECIMAL_SI}, memory=Quantity{number=21565440, format=BINARY_SI}}
后续
如果您不想这么麻烦,可以直接使用我编译好的 k8s 库,github 地址: https://github.com/hgfkeep/k8s-java-client
<dependency>
  <groupid>win.hgfdodo</groupid>
  <artifactid>k8sclient</artifactid>
  <version>0.1.0</version>
</dependency>
其中:
- tested kubernetes version:
- Server Version: v1.13.2
- Client Version: v1.15.5
- jdk: 1.8 及以上版本
正文到此结束
- 本文标签: Pods root pom cat RESTful CTO list core ORM bug java maven 线程 IDE 空间 XML src Service id 2019 目录 node description redis 注释 Docker client 处理器 部署 tab 数据 需求 json build 文章 Master tk 认证 js UI 代码 Select Uber Architect 工作原理 stream classpath https 配置 HTML5 Kubernetes 参数 ACE IO 单元测试 测试 git 安装 GitHub HTML REST 删除 自动生成 Proxy 编译 ip 集群 API App 插件 http plugin
- 版权声明: 本文为互联网转载文章,出处已在文章中说明(部分除外)。如果侵权,请联系本站长删除,谢谢。
- 本文海报: 生成海报一 生成海报二
热门推荐


相关文章


Loading...
![[HBLOG]公众号](http://www.liuhaihua.cn/img/qrcode_gzh.jpg)

