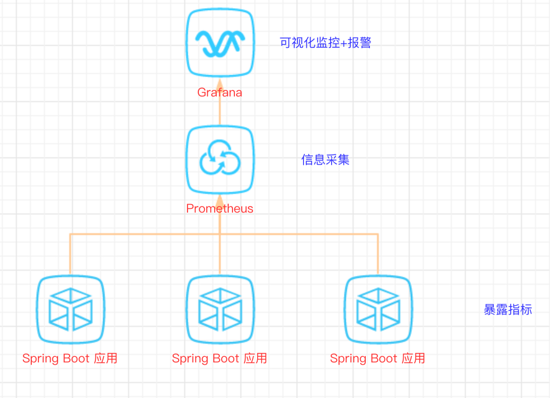
Spring-Boot-应用可视化监控
图文简介
快速开始
1、Spring Boot 应用暴露监控指标【版本 1.5.7.RELEASE】
首先,添加依赖如下依赖:
<dependency>
<groupId/>org.springframework.boot</groupId/>
        <artifactId/>spring-boot-starter-actuator</artifactId/>
    </dependency/>

    <dependency/>
        <groupId/>io.prometheus</groupId/>
        <artifactId/>simpleclient/_spring/_boot</artifactId/>
        <version/>0.0.26</version/>
    </dependency/>复制代码
然后,在启动类 Application.java 添加如下注解:
@SpringBootApplication
@EnablePrometheusEndpoint
@EnableSpringBootMetricsCollector
public class Application {
public static void main(String/[/] args) {
    SpringApplication.run(Application.class, args);
}
}复制代码
最后,配置默认的登录账号和密码,在 application.yml 中:
security:
user:
name: user
password: pwd复制代码
提示:不建议配置 management.security.enabled: false
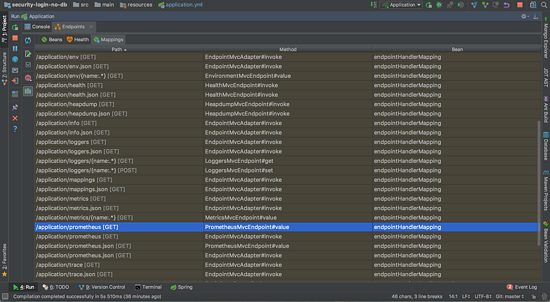
启动应用程序后,会看到如下一系列的 Mappings
利用账号密码访问 http://localhost:8080/application/prometheus ,可以看到 Prometheus 格式的指标数据 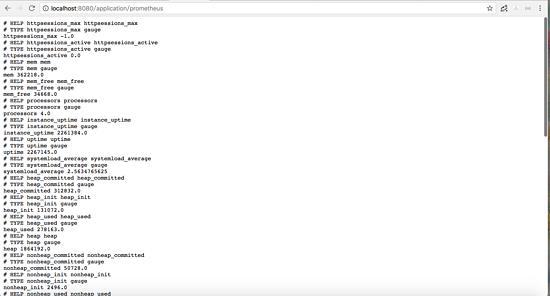
2、Prometheus 采集 Spring Boot 指标数据
首先,获取 Prometheus 的 Docker 镜像:
$ docker pull prom/prometheus复制代码
然后,编写配置文件 prometheus.yml :
global:
scrape_interval: 10s
scrape_timeout: 10s
evaluation_interval: 10m
scrape_configs:
- job_name: spring-boot
scrape_interval: 5s
scrape_timeout: 5s
metrics_path: /application/prometheus
scheme: http
basic_auth:
username: user
password: pwd
static_configs:
- targets:
- 127.0.0.1:8080 #此处填写 Spring Boot 应用的 IP + 端口号复制代码
接着,启动 Prometheus :
$ docker run -d /
--name prometheus /
-p 9090:9090 /
-m 500M /
-v "$(pwd)/prometheus.yml":/prometheus.yml /
-v "$(pwd)/data":/data /
prom/prometheus /
-config.file=/prometheus.yml /
-log.level=info复制代码
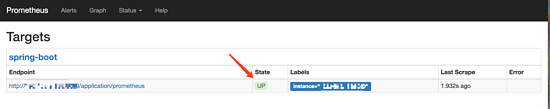
最后,访问 http://localhost:9090/targets , 检查 Spring Boot 采集状态是否正常。
3、Grafana 可视化监控数据
首先,获取 Grafana 的 Docker 镜像:
$ docker pull grafana/grafana复制代码
然后,启动 Grafana:
$ docker run --name grafana -d -p 3000:3000 grafana/grafana复制代码
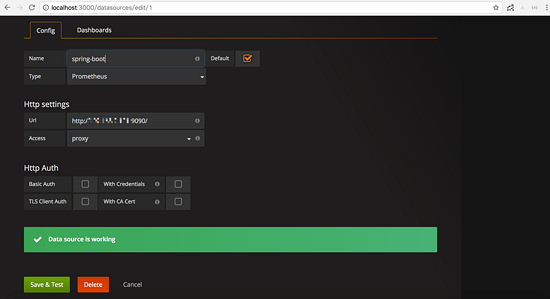
接着,访问 http://localhost:3000/ 配置 Prometheus 数据源:
Grafana 登录账号 admin 密码 admin
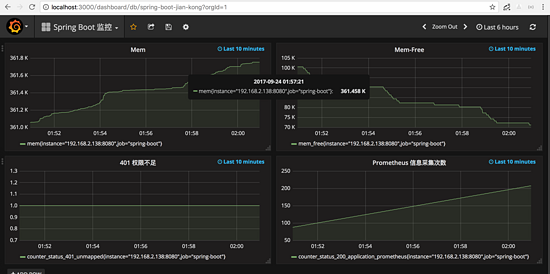
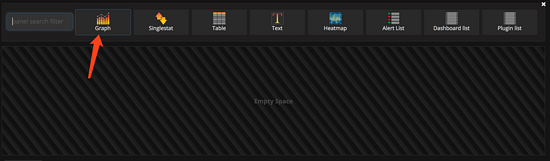
最后,配置单个指标的可视化监控面板:
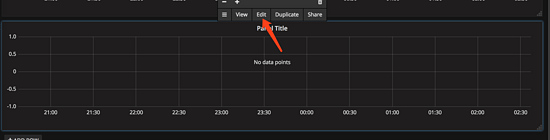
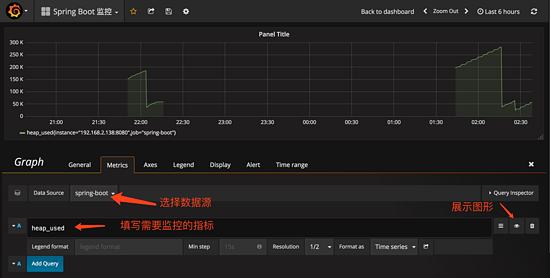
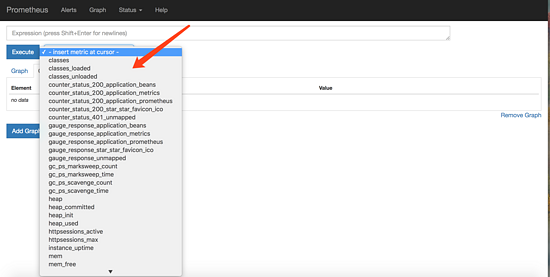
提示,此处不能任意填写,只能填已有的指标点,具体的可以在 Prometheus 的首页看到,即 http://localhost:9090/graph
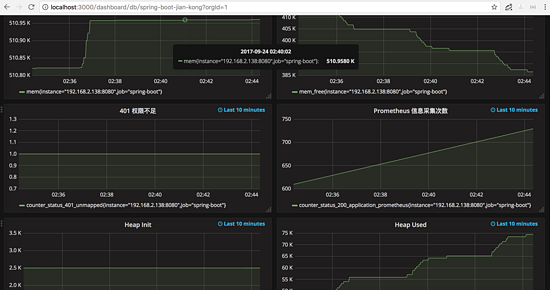
多配置几个指标之后,即可有如下效果:
正文到此结束
热门推荐


相关文章


Loading...
![[HBLOG]公众号](http://www.liuhaihua.cn/img/qrcode_gzh.jpg)

