SpringBoot系列之actuator监控管理极速入门与实践
@ TOC
SpringBoot官方提供了spring-boot-starter-actuator场景启动器用于系统的监控管理,可以通过HTTP,JMX,SSH协议来进行操作,自动得到审计、健康及指标信息等
环境准备:
- JDK 1.8
- SpringBoot2.2.1
- Maven 3.2+
- 开发工具
- IntelliJ IDEA
- smartGit
创建一个SpringBoot Initialize项目,详情可以参考我之前博客: SpringBoot系列之快速创建项目教程
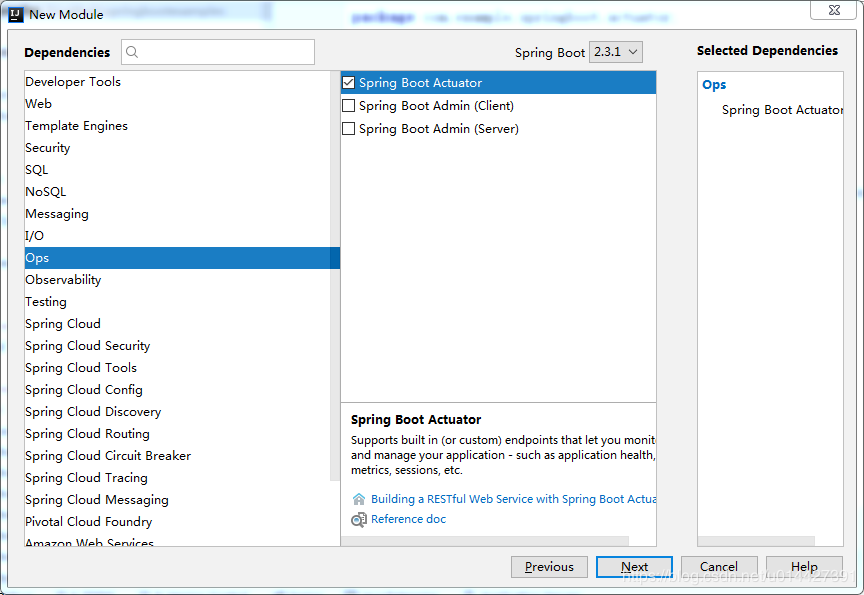
要将执行器添加到基于Maven的项目中,请检查添加以下“ Starter”依赖项:
<dependencies>
    <dependency>
        <groupId>org.springframework.boot</groupId>
        <artifactId>spring-boot-starter-actuator</artifactId>
    </dependency>
</dependencies>
复制代码
项目启动成功后,如果没设置context-path,项目会自动加入/actuator作为前缀,大部分端点是默认启动的,不过要通过web浏览器方式访问的只有health、info端点
可以通过配置修改默认前缀
management.endpoints.web.base-path=/actuator
复制代码
通用的端点(http、Jms、ssh方式都能访问):
| ID | 描述 | 默认启用 |
|---|---|---|
auditevents |
暴露当前应用程序的审计事件信息。 | 是 |
beans |
显示应用程序中所有 Spring bean 的完整列表。 | 是 |
caches |
暴露可用的缓存。 | 是 |
conditions |
显示在配置和自动配置类上评估的条件以及它们匹配或不匹配的原因。 | 是 |
configprops |
显示所有 @ConfigurationProperties 的校对清单。 |
是 |
env |
暴露 Spring ConfigurableEnvironment 中的属性。 |
是 |
flyway |
显示已应用的 Flyway 数据库迁移。 | 是 |
health |
显示应用程序健康信息 | 是 |
httptrace |
显示 HTTP 追踪信息(默认情况下,最后 100 个 HTTP 请求/响应交换)。 | 是 |
info |
显示应用程序信息。 | 是 |
integrationgraph |
显示 Spring Integration 图。 | 是 |
loggers |
显示和修改应用程序中日志记录器的配置。 | 是 |
liquibase |
显示已应用的 Liquibase 数据库迁移。 | 是 |
metrics |
显示当前应用程序的指标度量信息。 | 是 |
mappings |
显示所有 @RequestMapping 路径的整理清单。 |
是 |
scheduledtasks |
显示应用程序中的调度任务。 | 是 |
sessions |
允许从 Spring Session 支持的会话存储中检索和删除用户会话。当使用 Spring Session 的响应式 Web 应用程序支持时不可用。 | 是 |
shutdown |
正常关闭应用程序。POST请求方式 | 否 |
threaddump |
执行线程 dump。 | 是 |
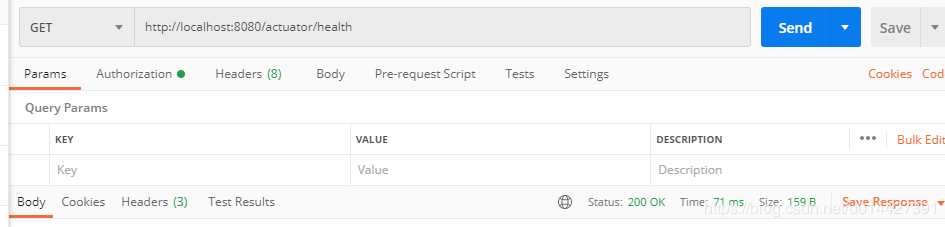
GET方式调用health端点,返回json信息
Web 应用程序(Spring MVC、Spring WebFlux 或 Jersey),则可以使用以下附加端点,这个应该是2.x版本才加上的
| ID | 描述 | 默认启用 |
|---|---|---|
heapdump |
返回一个 hprof 堆 dump 文件。 |
是 |
jolokia |
通过 HTTP 暴露 JMX bean(当 Jolokia 在 classpath 上时,不适用于 WebFlux)。 | 是 |
logfile |
返回日志文件的内容(如果已设置 logging.file 或 logging.path 属性)。支持使用 HTTP Range 头来检索部分日志文件的内容。 |
是 |
prometheus |
以可以由 Prometheus 服务器抓取的格式暴露指标。 | 是 |
启用端点,修改配置,语法 management.endpoint.[端点名称].enabled=true
management.endpoint.shutdown.enabled=true
复制代码
下表显示了内置端点和默认暴露情况,以JMX、WEB(Http)做对比:
| ID | JMX | Web |
|---|---|---|
auditevents |
是 | 否 |
beans |
是 | 否 |
caches |
是 | 否 |
conditions |
是 | 否 |
configprops |
是 | 否 |
env |
是 | 否 |
flyway |
是 | 否 |
health |
是 | 是 |
heapdump |
N/A | 否 |
httptrace |
是 | 否 |
info |
是 | 是 |
integrationgraph |
是 | 否 |
jolokia |
N/A | 否 |
logfile |
N/A | 否 |
loggers |
是 | 否 |
liquibase |
是 | 否 |
metrics |
是 | 否 |
mappings |
是 | 否 |
prometheus |
N/A | 否 |
scheduledtasks |
是 | 否 |
sessions |
是 | 否 |
shutdown |
是 | 否 |
threaddump |
是 | 否 |
要更改暴露的端点,请使用以下特定的 include 和 exclude 属性:
| 属性 | 默认 |
|---|---|
management.endpoints.jmx.exposure.exclude |
|
management.endpoints.jmx.exposure.include |
* |
management.endpoints.web.exposure.exclude |
|
management.endpoints.web.exposure.include |
info, health |
include 属性列出了暴露的端点的 ID。 exclude 属性列出了不应暴露的端点的 ID。 exclude 属性优先于 include 属性。
例子: 关闭jmx访问所有端点的权限,只让其能访问health、info
management.endpoints.jmx.exposure.include=health,info
复制代码
启用web访问所有端点,除env之外的权限
management.endpoints.web.exposure.include=*
management.endpoints.web.exposure.exclude=env
复制代码
注意
* 在 YAML 中具有特殊含义,因此如果要包含(或排除)所有端点,请务必添加引号,如下所示:
management:
  endpoints:
    web:
      exposure:
        include: "*"
复制代码
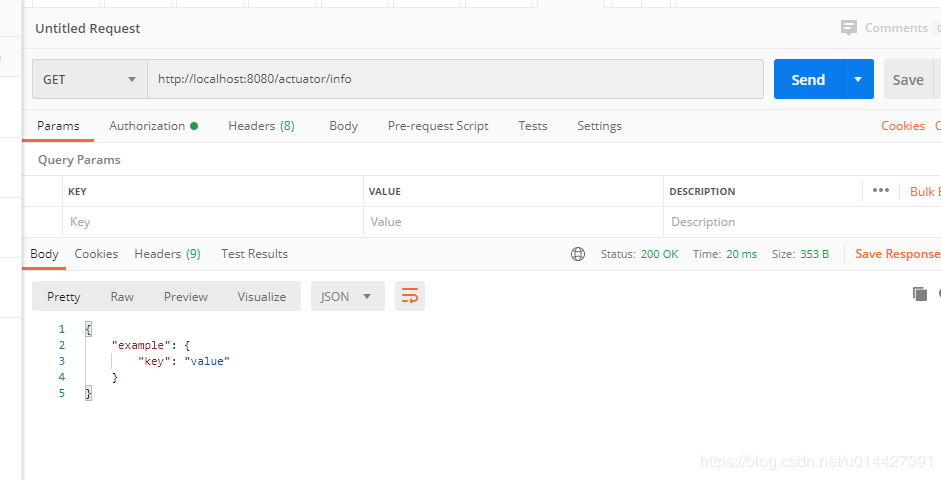
自定义InfoContributor
package com.example.springboot.actuator.actuate.health;

import java.util.Collections;

import org.springframework.boot.actuate.info.Info;
import org.springframework.boot.actuate.info.InfoContributor;
import org.springframework.stereotype.Component;

@Component
public class ExampleInfoContributor implements InfoContributor {

    @Override
    public void contribute(Info.Builder builder) {
        builder.withDetail("example",
                Collections.singletonMap("key", "value"));
    }

}
复制代码
可以在浏览器或者postman调用:
跨域支持配置
management.endpoints.web.cors.allowed-origins=http://localhost
management.endpoints.web.cors.allowed-methods=GET,POST
复制代码
定置端点:
management.endpoint.info.enabled=true
management.endpoint.info.cache.time-to-live=10s
复制代码
ok,actuator的知识点比较多,详情请参考 官方文档 ,本博客参考官方文档,做了简单记录,仅仅作为入门参考手册
代码例子下载: code download
很遗憾的说,推酷将在这个月底关闭。人生海海,几度秋凉,感谢那些有你的时光。
原文 https://juejin.im/post/5f1963e6e51d4534c4553b8a正文到此结束
- 本文标签: 数据库 id 响应式 build spring JMS UI key 删除 服务器 tar Collection 代码 example Logging maven 配置 缓存 Collections http web js IO 管理 开发 下载 tab map session json ask ssh https cache IDE dependencies ACE classpath 线程 springboot App src java bean git 数据 value 博客 协议
- 版权声明: 本文为互联网转载文章,出处已在文章中说明(部分除外)。如果侵权,请联系本站长删除,谢谢。
- 本文海报: 生成海报一 生成海报二
热门推荐


相关文章


Loading...
![[HBLOG]公众号](https://www.liuhaihua.cn/img/qrcode_gzh.jpg)

