R之折线图
需求:
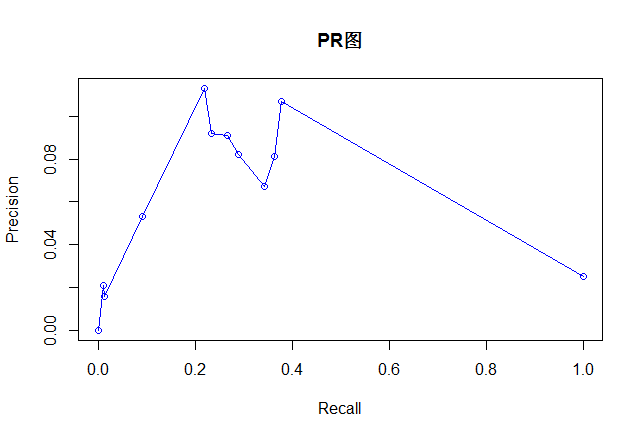
用R语言画折线图
实现:
xiao <- read.table("d:/final.txt",header=T,sep=",") data<-xiao[order(-xiao[,2]),] Precision<-data[,1] Recall<-data[,2] plot(Recall,Precision,type="o",main="PR图",col="blue",frame.plot=TRUE) 对应的数据文件参见附件
显示图如下:
 参数说明:
参数说明:
plot(x, y, type,main,col,frame.plot...)
x:x的数据列
y:y的数据列
type包括如下:
"p" for points,
"l" for lines,
"b" for both,
"c" for the lines part alone of "b",
"o" for both ‘overplotted’,
"h" for ‘histogram’ like (or ‘high-density’) vertical lines,
"s" for stair steps,
"S" for other steps, see ‘Details’ below,
"n" for no plotting.
main:an overall title for the plot: see title.
更多参见
help(plot)
正文到此结束
热门推荐


相关文章

近期评论
-
你这基本没有更新呀,最近文章显示还是2019年的文章。不符合要求哈
-
关键词:慕云博客 链接:https://www.lilun.me 描述:分享原创文字的个人博客
-
-
-
可以提供一下源码吗
-
不是商业站,鸡娃学习笔记
-
-
-
-
听他们说很厉害的样子
Loading...
![[HBLOG]公众号](http://www.liuhaihua.cn/img/qrcode_gzh.jpg)

