cowplot:基于ggplot的可视化系统
GitHub 主页:
https://github.com/wilkelab/cowplot
CRAN 包地址:
http://cran.r-project.org/web/packages/cowplot/index.html
包描述:
The cowplot package is a simple add-on to ggplot2. It is meant to provide a publication-ready theme for ggplot2, one that requires a minimum amount of fiddling with sizes of axis labels, plot backgrounds, etc. Its primary purpose is to give my students and postdocs an easy way to make figures that I will approve of. Thus, this package meets my personal needs and tastes. Yours may be different.
Some helpful extensions and modifications to the ‘ggplot2′ library. In particular, this package makes it easy to combine multiple ‘ggplot2′ plots into one and label them with letters, e.g. A, B, C, etc., as is often required for scientific publications. The package also provides a streamlined and clean theme that is used in the Wilke lab, hence the package name, which stands for Claus O. Wilke’s plot library.
包解读:
现在每次绘制GGplot的图,都会使用 theme_bw()去除灰色的背景信息,现在使用cowplot 似乎变的很简单,图的排列和注释也变得很简单。
代码实例:
代码:
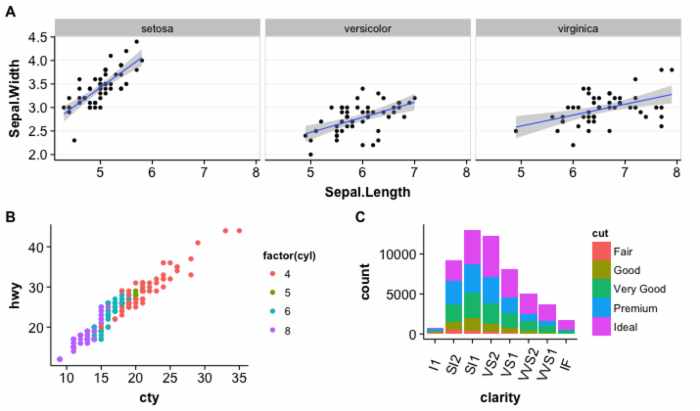
library(ggplot2) require(cowplot) plot.mpg <- ggplot(mpg, aes(x = cty, y = hwy, colour = factor(cyl))) + geom_point(size=2.5) plot.diamonds <- ggplot(diamonds, aes(clarity, fill = cut)) + geom_bar() + theme(axis.text.x = element_text(angle=70, vjust=0.5)) plot.iris <- ggplot(iris, aes(Sepal.Length, Sepal.Width)) + geom_point() + facet_grid(. ~ Species) + stat_smooth(method = "lm") + background_grid(major = 'y', minor = "none") + panel_border() ggdraw() + draw_plot(plot.iris, 0, .5, 1, .5) + draw_plot(plot.mpg, 0, 0, .5, .5) + draw_plot(plot.diamonds, .5, 0, .5, .5) + draw_plot_label(c("A", "B", "C"), c(0, 0, 0.5), c(1, 0.5, 0.5), size = 15) 结果:
正文到此结束
热门推荐


相关文章


Loading...
![[HBLOG]公众号](http://www.liuhaihua.cn/img/qrcode_gzh.jpg)

