DIY Ruby CPU 分析——Part III
【编者按】作者 Emil Soman,Rubyist,除此之外竟然同时也是艺术家,吉他手,Garden City RubyConf 组织者。本文是 DIY Ruby CPU Profiling 的第二部分。本文系OneAPM 工程师编译整理。
 在第一部分我们了解到仪表分析器如何工作,在第二部分我们学习到 如何使用 CPU time 和 Wall time 测量执行时间 。建议在继续学习之前先阅读一下那些内容。本章我们将应用学到的目前为止知识做一个很基础的仪表 CPU 分析器。
Part III. DIY 仪表 CPU 分析器
Ruby 的仪表盘
在第一部分,我们学到了仪表分析工具利用能够被分析工具安装或由语言自身提供的 hooks 来工作。幸运的是,Ruby 早就拥有这些 hooks 并且提供纤巧的 TracePoint 类来使用这些 hooks。
TracePoint API
执行代码时,Ruby VM 发送一系列事件到不同的节点。Ruby 允许利用 TracePoint 类进行事件回调。 TracePoint 的 API 文档列出了所有可以监听的事件,但我们只对下面两个感兴趣:
-
:call,当 Ruby 方法调用时被触发。 -
:return, 当 Ruby 方法返回时被触发。
我们可以通过TracePoint.new方法创造 tracepoint 对象并传递一个事件类型进行监听,同时传递部分在事件触发时执行的代码。下面是为:call和:return事件创造 tracepoint 的代码。
trace = TracePoint.new(:call, :return) do |trace| puts "Method: #{trace.method_id}, event: #{trace.event}" end 被传到回调代码块的参数 trace 使你能够访问一系列 tracepoint 的属性,通过它们更加了解被触发的事件。举个例子,我们需要通过 method_id 属性得到 method name,通过 event 属性得到被触发的事件名。上文提到的回调代码块中将显示出方法名和被触发的事件类型,每一次都会伴随着 Ruby 方法的调用或返回。 建立 tracepoint 之后,需要将其变成可用状态:
trace.enable 一旦 tracepoint 变成可用状态,我们便可以创建方法对它进行调用,并且看我们出发的回调命令是否被执行。
def hello end hello #=> Method: hello, event: call #=> Method: hello, event: return 不错,我们的回调命令如预期的一样被执行了两次。
diy_prof gem
最后我们将结合之前学过的东西创造一个 RubyGem,并将这个 gem 命名为 diy_prof. 关于此 gem 的资源放在 github 上。 现在我们就用 bundler 来建造这个 gem:
bundle gem diy_prof 这就造出了我们将要做的项目的骨架。接着,我们将建立在 Part II 中介绍过的包含 cpu_time 和 wall_time 方法的 TimeHelpers 模块:
# lib/diy_prof/time_helpers.rb module DiyProf::TimeHelpers # These methods make use of `clock_gettime` method introduced in Ruby 2.1 # to measure CPU time and Wall clock time. def cpu_time Process.clock_gettime(Process::CLOCK_PROCESS_CPUTIME_ID, :microsecond) end def wall_time Process.clock_gettime(Process::CLOCK_MONOTONIC, :microsecond) end end 我们还需要请求 gem 主文件中的这个文件 lib/diy_prof.rb :
# lib/diy_prof.rb require 'diy_prof/version' require 'diy_prof/time_helpers' # Rest of the original file .. 下一步,当一个 :call 或 return 事件发生时,我们将通过 gem 里的 TracePoint API 来显示时间。
module DiyProf class Tracer include TimeHelpers def initialize(clock_type: :cpu) @tracepoint = TracePoint.new(:call, :return) do |trace| time = clock_type == :wall ? wall_time : cpu_time printf("%-20s:%-20s%-20s/n", time, trace.event, trace.method_id) end end def enable @tracepoint.enable end def disable @tracepoint.disable end end end 同时,我们需要再一次调用这个 gem 主文件中的文件:
# lib/diy_prof.rb require 'diy_prof/version' require 'diy_prof/time_helpers' require 'diy_prof/tracer' # Rest of the original file .. 现在,让我们来写一个例子脚本来测试至今为止创造了什么。我们将使用在 Part I 中见过的那个例子:
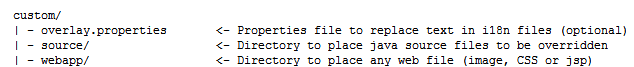
# examples/demo.rb $:<< File.join(File.dirname(__FILE__), "../lib") require 'diy_prof' ### Begin sample program ### def main 3.times do find_many_square_roots find_many_squares end end def find_many_square_roots 5000.times{|i| Math.sqrt(i)} end def find_many_squares 5000.times{|i| i**2 } end ### End sample program ### tracer = DiyProf::Tracer.new(clock_type: :cpu) tracer.enable main tracer.disable 如果运行了以上 Ruby 程序,我们将得到下列结果:  第一列显示的是被触发事件的 CPU time,第二列是被触发的事件名,第三列是被调用或返回的方法名。这个结果与在 Part I 中学习仪表分析器如何工作时看到的结果很相似。可以看到,我们能够轻松地通过这个结果重建调用,因为我们可以知道各个方法间的调用关系。写一个能解析这个结果并按执行时间有序显示方法列的脚本并不是很难。但这太无聊了,我们可以建造更有趣的东西。看着吧,下一部分将学习我们能够利用这些数据来做的其他事情。
概括
我们学习了 Ruby 的 TracePoint API 以及如何用它监听方法的调用和返回。同时我们整合写过的代码建立了一个能够显示 Ruby 程序的执行 trace 的 gem。在第四部分我们将学习如何有效利用 gem 收集到的数据并通过它们创造一些很酷的调用图。感谢阅读!如果你想要阅读 DIY CPU 分析系列的其他最新文章,请关注我们的 twitter @codemancershq.
OneAPM for Ruby 能够深入到所有 Ruby 应用内部完成应用性能管理和监控,包括代码级别性能问题的可见性、性能瓶颈的快速识别与追溯、真实用户体验监控、服务器监控和端到端的应用性能管理。 想阅读更多技术文章,请访问OneAPM 官方博客。
正文到此结束
热门推荐


相关文章


Loading...
![[HBLOG]公众号](https://www.liuhaihua.cn/img/qrcode_gzh.jpg)

