玩,科比投篮数据
玩,科比投篮数据
[TOC]
本文完全出于个人兴趣,深知写的很不好,如果有对你心中的神有不敬的地方请放过在下。作为一个打球很烂的伪球迷,不去褒贬这里只有数据和我的乐趣。
问题
问题是Kaggle 在科比退役之际出的一个题,题目的描述我摘抄在下面:
Kobe Bryant marked his retirement from the NBA by scoring 60 points in his final game as a Los Angeles Laker on Wednesday, April 12, 2016. Drafted into the NBA at the age of 17, Kobe earned the sport’s highest accolades throughout his long career.
Using 20 years of data on Kobe's swishes and misses, can you predict which shots will find the bottom of the net? This competition is well suited for practicing classification basics, feature engineering, and time series analysis. Practice got Kobe an eight-figure contract and 5 championship rings. What will it get you?
在公司各位大神的帮助下我大概搞清楚了要干什么。题目给到的数据是科比过去20年投过的30697个球的数据,其中有很多维度,具体见下表. 30697投球中个有5000个球进没进是不知道的,这个题的目的就是用剩下的进了和没进的球(14232没进,11465进了)的情况去预存这未知的5000个球是进还是不进。
| 字段名称 | 我的注释| |-------------- | ------ ------- | |action type| 投球的类型,如Jump Shot(跳投) | |combined shot type| 是比action type 更粗的分类| |game event id| 一个id,具体还以不详| |game id| 比赛的id| |lat|投球的维度(投篮位置在地球的维度)| |loc x|投篮位置相对篮筐的横向坐标| |loc y|投篮位置相对篮筐的纵向坐标| |lon|投篮位置的经度(这个确实是地球的经度)| |minutes remaining| 比赛剩余分钟| |period| 比赛第几节| |playoffs|是否是季后赛| |season |赛季| |seconds remaining|比赛剩余秒| |shot distance|投篮位置到篮筐的距离| |shot made flag (this is what you are predicting)|是否投中| |shot type|3分还是2分| |shot zone area|投篮区域后面会看到具体的| |shot zone basic|投篮区域,和上面是不同的划分方法,见下面的图| |shot zone range|| |team id|这个是一个值,Kobe 所在球队| |team name|球队名称,这个也是一个常量:Los Angeles Lakers| |game date|比赛时间| |matchup|这个能看出对手,是否主场,客场| |opponent|对手| |shot_id|投球的id|
其实这个题我觉得比较有意思,所以才做。比较难的是从这么多变量中选择有用的变量,并用好的方式来处理这些特征,然后就是很常见的分类问题。至于什么方法随便选。
数据初探
既然是数据,我们就先拿点出来看看长什么样,由于最终是要预测命中否,所以我的关注点是命中率。
投篮位置的命中率分布
用下面的代码画了几个图,由于对Pandas ,Matplotlib 不是特别熟悉,所有这里的代码个人还不满意,虽然实现了功能。 ```
def plot shot basic range(): """ plot 不同区域的 命中率 """ df = load data() train = df.loc[df['shot made flag'].isin([0,1])] basic zone list = list(set(train.shot zone basic)) rate data = {} plot data = {} for zone in basic zone list: zone data = train.loc[train.shot zone basic==zone] rate data[zone] = {} rate data[zone]['size'] = zone data.count()['shot zone basic'] rate data[zone]['rate'] = 100.0*zone data.loc[zone data['shot made flag']==1].count()['shot made flag']/rate data[zone]['size'] plot data[zone] = {} plot data[zone]['x'] = train.loc[train.shot zone basic==zone].loc x plot data[zone]['y'] = train.loc[train.shot zone basic==zone].loc_y
plt.figure() color_list = ['r','g', 'b', 'c','m','k','y'] for index in range(len(basic_zone_list)): zone = basic_zone_list[index] plt.plot(plot_data[zone]['x'], plot_data[zone]['y'],c = color_list[index] ,linestyle='', marker='o', label='%.2f, %s'%(rate_data[zone]['rate'],zone)) plt.legend() ax = plt.gca() ax.set_ylim([-50,900]) plt.show()
``` 基于 shot zone basic  基于shot zone range
 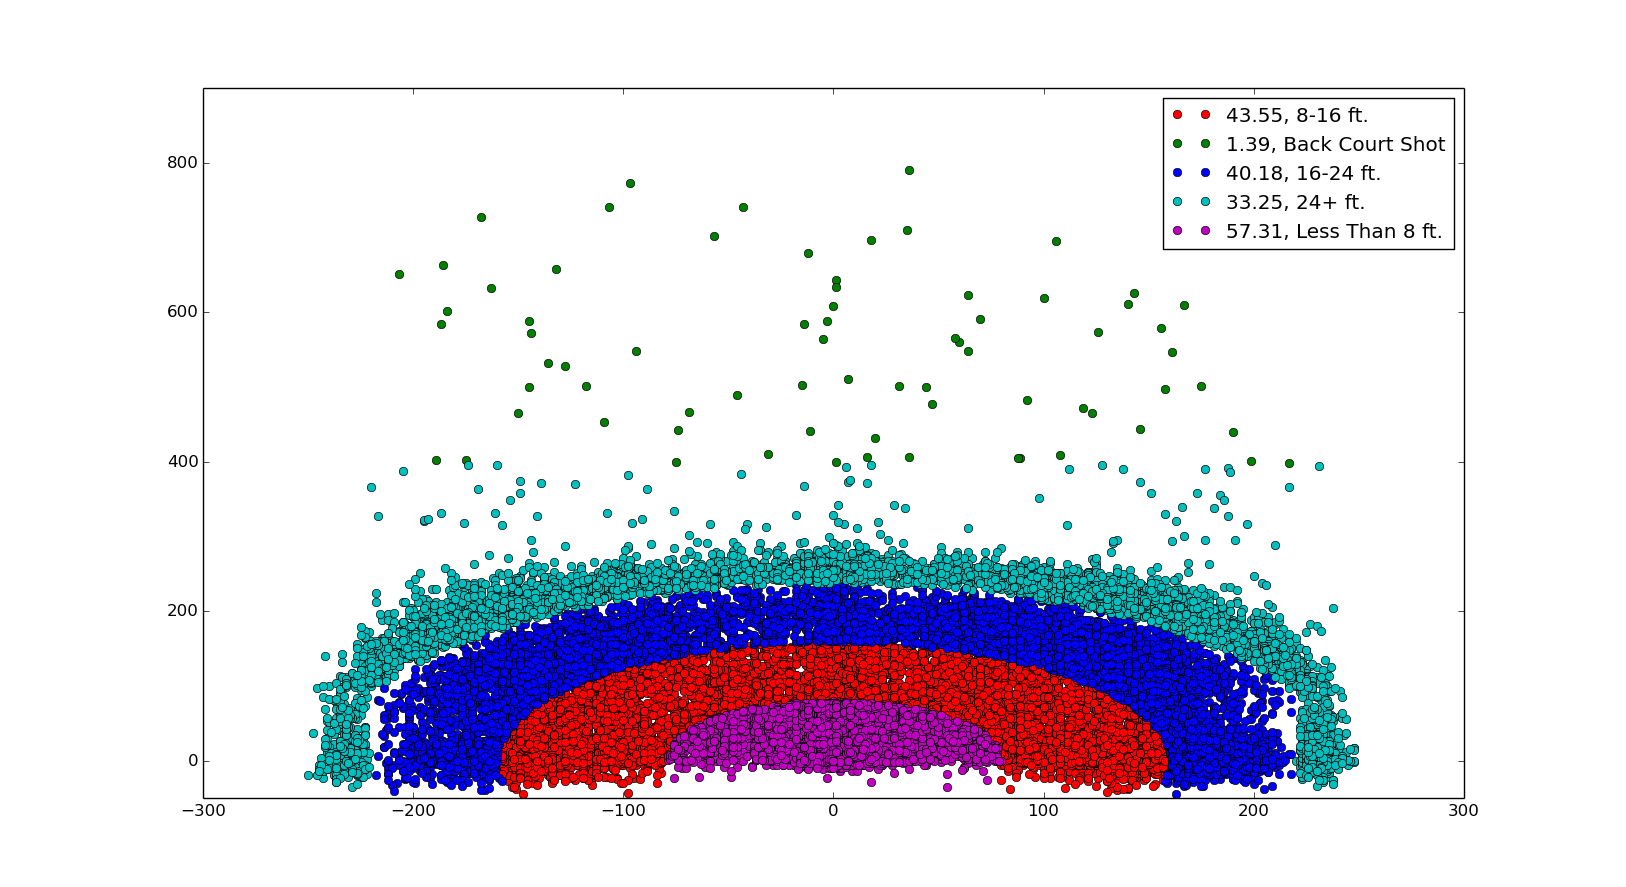 看到上面两个字段的区别了吧。其实这个图给我们分析带来的价值并不大,或许你想说科比喜欢在什么位置投球,什么位置命中率高,这个对这个题没什么价值,因为基本所有人都是越近越准,在没有和其他人进行对比的情况下我们并看不出什么,位置肯定会最为影响命中率的维度加入建模的,毫无疑问。
不同赛季的命中
 这个是每个赛季的命中率,从图上可以看到科比从进入NBA开始两三年都在成长,后面基本比较稳定,但是也有低估,可能是伤病,可能是其他,没人知道是为什么,因为这通常都是大量因素的综合影响。
不同对手的命中率分布
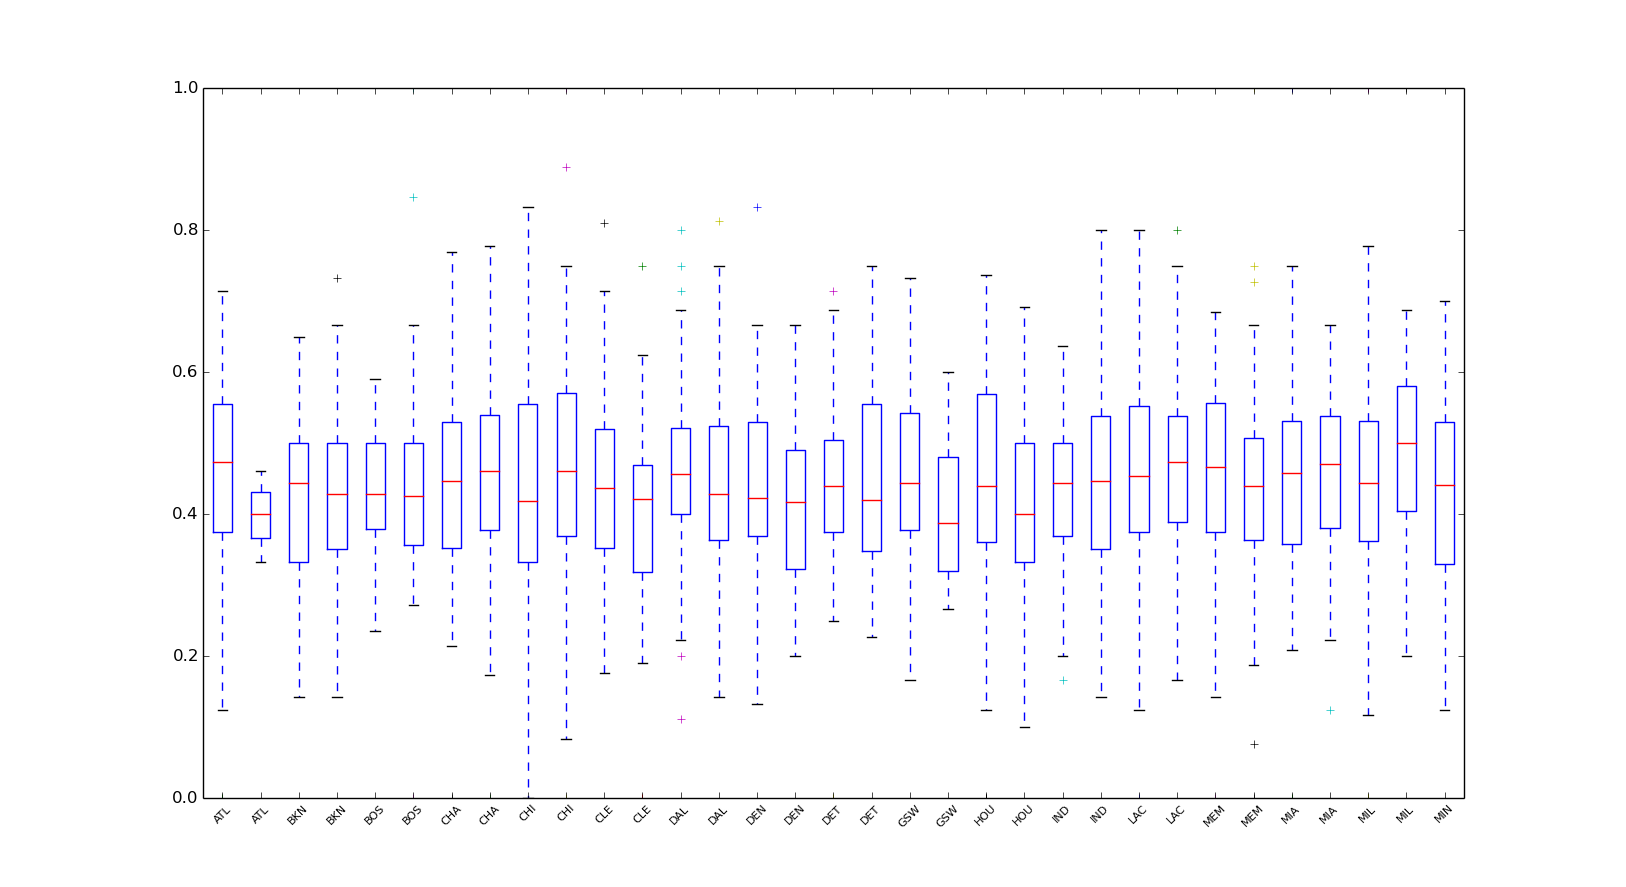 在面对不同对手,差异还是蛮大的,这应该是对方的防守有关系。
命中率预测
上面整了这么多,都是炫技而已。仔细考虑之后选取了几个因素作为输入,采用SVM 作为最初的尝试。为什么是SVM? 我也说不好,我只是觉得用着顺手,就像你手上有把锤子,遇到任何事情都想去敲一个道理。 选取的维度如下:
` values_col = [ 'action_type', 'loc_x', 'loc_y', 'minutes_remaining', 'period', 'playoffs', 'season', 'seconds_remaining', 'opponent', 'shot_id', 'shot_made_flag', ]
建模的代码,省去了数据处理部分 ``def train model svm(): df = load data() data array = hand data(df) pre data = data array[np.isnan(data
array[:,-1].tolist())]
reverse = np.isnan(data_array[:,-1].tolist()) reverse = map(lambda x: False if x else True, reverse) train_data = data_array[np.array(reverse)] np.random.shuffle(train_data) test_data = train_data[:5000] train_data = train_data[5000:] X = train_data[:,:-2] Y = train_data[:,-1] Y=Y.astype(int) clf = svm.SVC() clf.fit(X, Y) P = sum(test_data[:,-1]) predict_lable = clf.predict(test_data[:,:-2]) min_label = predict_lable-test_data[:,-1].astype(int) fn=np.sum(min_label[min_label==1]) tp = P-fn print 'fn:',fn fp = np.sum(min_label[min_label==-1])*-1 tn = 5000-P-fp print 'tp:',tp print 'fn:',fn print 'fp:',fp print 'tn:',tn print 'P:',P result_label = clf.predict(pre_data[:,:-2]) result_label = result_label.reshape(5000,1) index_ = pre_data[:,-2].reshape(5000,1) result_data = np.hstack((index_,result_label)) result_df = pd.DataFrame(result_data, columns=['id','cuisine']) result_df.to_csv('result.csv') ``` 上面是比较核心的代码, 可以看到SVM 的参数也没做任何调整,为了看效果看下面的混淆矩阵好了,其实不算好,但是能说明还是科比投篮是有规律可循的,下一步就是要做各种尝试,比如参数,换其他方法什么的,这个题很多方法都行。
|实际| 中|不中| |------|------|-------| |中| 2065|157| |不中|1919| 859| 总的准确率大概在58%
用这个模型做完预存传到Kaggle 效果并不好,现在排名靠后, 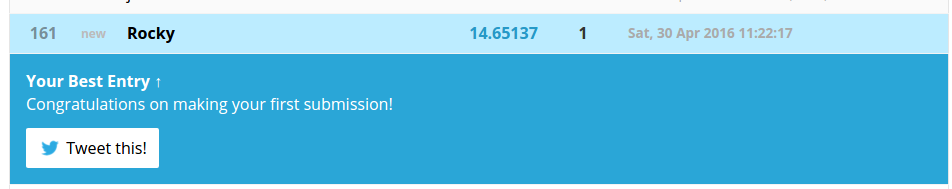 但是看到第一名提交了28次答案我也就释然了,打算尝试提交更多次,如果有收获再记录。
正文到此结束
热门推荐


相关文章

近期评论
-
谢谢
-
https://www.newcmy.com/register?aff=HBVX建议您试试草莓云机场,可以流畅观看youtube和tiktok,上reddit/x也没有问题,还有各种ai优化节点。
-
-
-
想购买您这个站,我的联系方式QQ741756694微信同步 能卖联系
-
-
-
-
-
https://www.liuhaihua.cn/archives/40657.html 这篇博客中的图片打不开了
Loading...
![[HBLOG]公众号](https://www.liuhaihua.cn/img/qrcode_gzh.jpg)

