SpringCloud + Opentracing + jaeger调用链解决方案
发展历史
背景
在上一篇文章中,我们探讨了调用链的主要因素并针对几个典型的产品进行了一下对比( 服务调用链的主要因素和简要对比 )。
Tracing 是在90年代就已出现的技术。但真正让该领域流行起来的还是源于 Google 的一篇论文 "Dapper, a Large-Scale Distributed Systems Tracing Infrastructure" ,而另一篇论文 "Uncertainty in Aggregate Estimates from Sampled Distributed Traces" 中则包含关于采样的更详细分析。上一篇文章几个典型就属于第一代调用链产品。
OpenTracing
可是市面上的产品实在太多了,基本上每个成规模的公司都实现了自己的一套小九九。它们互不兼容,各种集成困难,尤其对于异构跨语言的系统,实现调用链几乎是一个噩梦。在这种状态下, OpenTracing 协议横空出世。
OpenTracing 只是一种协议,是一种标准化。没有它,你的应用程序照样会玩的很好,只不过失去了和其他组件交流的能力。
每一次技术迭代都是对过去技术的抽象和升华。 OpenTracing 同样抽象出调用链必须的数据模型,只需要按照其标准,一个golang语言的程序和java语言的跨平台调用链就可以很容易的实现。
官网: http://opentracing.io/
典型服务端产品
支持 OpenTracing 的开源产品可以在这里找到 : http://opentracing.io/documentation/pages/supported-tracers.html
典型的如 SpringCloud 集成的 Zipkin 。
我们要着重推荐的,是另一款叫做 Jaeger (丫哥)的产品。 Jaeger 是 Uber 开发的一款调用链服务端产品,开发语言为 golang ,能够兼容接收 OpenTracing 格式的数据。根据其 发展历史 ,可以说是 Zipkin 的升级版。另外,其基于 udp (也可以 http )的传输协议,更加定位了其高效、迅速的特点(lol,可能有那么一小点不可靠)
原创文章,转载注明出处 (http://sayhiai.com)
jaeger
下载可以在github上下载二进制文件。
https://github.com/jaegertracing/jaeger/releases/
jaeger的安装特别的简单。下载其二进制版本,仅有几个执行文件和配置文件(golang编译类型的功劳)。
[root@s17 jaeger-1.5.0-linux-amd64]# ll | grep -v sh$ | grep -v log$
total 90M
-rwxrwxr-x 1 2000 2000  16M May 28 23:29 jaeger-agent
-rwxrwxr-x 1 2000 2000  25M May 28 23:29 jaeger-collector
-rwxrwxr-x 1 2000 2000  22M May 28 23:29 jaeger-query
-rwxrwxr-x 1 2000 2000  27M May 28 23:29 jaeger-standalone
drwxrwxr-x 3 2000 2000   19 May 28 23:29 jaeger-ui-build
架构介绍
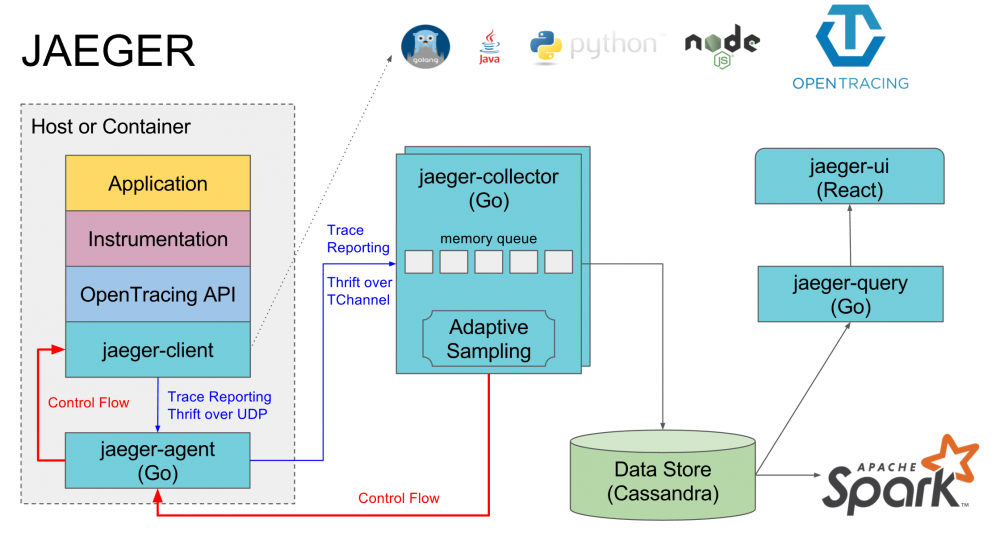
如上图所示,Jaeger 主要由以下几部分组成。
Jaeger Client
Agent
Collector
Data Store
Query
启动停止
Collector
nohup ./jaeger-collector --es.server-urls http://192.168.3.230:9200/ --log-level=debug > collector.log 2>&1 &
Agent
nohup ./jaeger-agent --collector.host-port=192.168.3.237:14267 --discovery.min-peers=1 --log-level=debug > agent.log 2>&1 &
Query
nohup ./jaeger-query --span-storage.type=elasticsearch --es.server-urls=http://192.168.3.230:9200/ > query.log 2>&1 &
停止
直接 kill -9
supervisor管理
建议使用 supervisor 管理进程,具体使用可以参考 使用supervisor管理Linux的应用服务
为了方便大家使用,直接将 supervisor 配置贴上来。
agent
[root@s17 jaeger-1.5.0-linux-amd64]# cat /etc/supervisord/conf.d/agent.conf
[program:agent]
command     = /root/jaeger-1.5.0-linux-amd64/jaeger-agent  --collector.host-port=192.168.3.237:14267 --discovery.min-peers=1 --log-level=debug
directory   = /root/jaeger-1.5.0-linux-amd64
user        = root
startsecs   = 3

redirect_stderr         = true
stdout_logfile_maxbytes = 50MB
stdout_logfile_backups  = 10
stdout_logfile          = agent.log
collect
[root@s17 jaeger-1.5.0-linux-amd64]# cat /etc/supervisord/conf.d/collect.conf
[program:collect]
command     =  /root/jaeger-1.5.0-linux-amd64/jaeger-collector  --es.server-urls http://192.168.3.230:9200/  --log-level=debug
directory   = /root/jaeger-1.5.0-linux-amd64
user        = root
startsecs   = 3

redirect_stderr         = true
stdout_logfile_maxbytes = 50MB
stdout_logfile_backups  = 10
stdout_logfile          = collect.log
query
[root@s17 jaeger-1.5.0-linux-amd64]# cat /etc/supervisord/conf.d/query.conf
[program:query]
command     = /root/jaeger-1.5.0-linux-amd64/jaeger-query --span-storage.type=elasticsearch --es.server-urls=http://192.168.3.230:9200/
directory   = /root/jaeger-1.5.0-linux-amd64
user        = root
startsecs   = 3

redirect_stderr         = true
stdout_logfile_maxbytes = 50MB
stdout_logfile_backups  = 10
stdout_logfile          = query.log
SpringCloud集成
支持
眼下最主流的微服务架构就是 SpringCloud ,针对 OpenTracing , SpringCloud 有比较多的库可以使用,常用的有这些(排名不分先后):
- https://github.com/opentracing-contrib/java-mongo-driver
- https://github.com/opentracing-contrib/java-memcached-client
- https://github.com/opentracing-contrib/java-redis-client
- https://github.com/opentracing-contrib/java-spring-zipkin
- https://github.com/opentracing-contrib/java-spring-jaeger
- https://github.com/opentracing-contrib/java-spring-cloud
- https://github.com/opentracing-contrib/java-spring-web
- ...
算了,太多,大家自己看吧。对于 SpringCloud 其实引入一个pom就包括大部分功能了(它自己依赖其他组件),例如:
<dependency>
  <groupId>io.opentracing.contrib</groupId>
  <artifactId>opentracing-spring-jaeger-web-starter</artifactId>
</dependency>
怎么实现的呢?其实这些组件,大量使用了Spring的 AutoConfiguration 功能,接下来我们以注解为例说明其如何实现的。
扩展
我们接下来实现的功能是:任何加了 @OwlTrace 注解的方法,都将产生一条调用链信息。
首先,我们要定义一个注解:
import java.lang.annotation.*;
@Target({ElementType.METHOD})
@Retention(RetentionPolicy.RUNTIME)
@Documented
public @interface OwlTrace {
}
然后,实现其处理类。代码通过 AOP 对Spring管理的Bean进行拦截,非常简单的实现了 Trace 信息的构造。代码如下:
import io.opentracing.Span;
import io.opentracing.Tracer;
import io.opentracing.tag.Tags;
import lombok.extern.slf4j.Slf4j;
import org.aspectj.lang.ProceedingJoinPoint;
import org.aspectj.lang.annotation.Around;
import org.aspectj.lang.annotation.Aspect;
import org.springframework.beans.factory.annotation.Autowired;
import org.springframework.context.annotation.Bean;
import org.springframework.context.annotation.Configuration;
import org.springframework.context.annotation.Lazy;

import java.util.LinkedHashMap;
import java.util.Map;


@Configuration
@Slf4j
public class OwlTraceAutoConfiguration {
    static final String TAG_COMPONENT = "java";

    @Autowired
    @Lazy
    Tracer tracer;

    @Bean
    public TracingAspect pxTracingAspect() {
        return new TracingAspect();
    }

    @Aspect
    class TracingAspect {
        @Around("@annotation(cn.px.arch.trace.annotation.OwlTrace)")
        public Object pxTraceProcess(ProceedingJoinPoint pjp) throws Throwable {
            Span span = null;
            if (tracer != null) {
                final String cls = pjp.getTarget().getClass().getName();
                final String mName = pjp.getSignature().getName();
                span = tracer.buildSpan(cls + "." + mName)
                        .withTag(Tags.COMPONENT.getKey(), TAG_COMPONENT)
                        .withTag("class", cls)
                        .withTag("method", mName)
                        .startActive(false)
                        .span();
            }
            try {
                return pjp.proceed();
            } catch (Throwable t) {
                Map<String, Object> exceptionLogs = new LinkedHashMap<>(2);
                exceptionLogs.put("event", Tags.ERROR.getKey());
                exceptionLogs.put("error.object", t);
                span.log(exceptionLogs);
                Tags.ERROR.set(span, true);
                throw t;
            } finally {
                if (tracer != null && span != null) {
                    span.finish();
                }
            }
        }
    }
}
最后,根据 Spring 的加载方式,将路径添加到 src/main/resources/META-INF/spring.factories 中:
org.springframework.boot.autoconfigure.EnableAutoConfiguration=/
arch.trace.core.owl.OwlTraceAutoConfiguration,/
arch.trace.core.log.LoggingAutoConfiguration
将组件打成 jar 包,一个 spring boot starter 就实现了。
使用
application.properties
确保开了 AOP
# AOP
spring.aop.auto=true
spring.aop.proxy-target-class=true

opentracing.jaeger.log-spans=true
opentracing.jaeger.udp-sender.host=192.168.3.237
opentracing.jaeger.udp-sender.port=5775
正文到此结束
- 本文标签: dist struct 安装 下载 UDP zipkin 开源 Agent 编译 grep http redis IO Document mongo java client ip map 文章 代码 Spring Boot final Proxy root tar ECS 数据 cache HTML bug spring build cat 数据模型 GitHub id 开发 HashMap PHP https core UI bean App 模型 linux 详细分析 pom 产品 ACE Google 服务端 key EnableAutoConfiguration web src git 配置 Logging CTO Elasticsearch Uber 微服务 协议 进程 排名 管理 AOP URLs springcloud zip
- 版权声明: 本文为互联网转载文章,出处已在文章中说明(部分除外)。如果侵权,请联系本站长删除,谢谢。
- 本文海报: 生成海报一 生成海报二
热门推荐


相关文章

近期评论
-
谢谢
-
https://www.newcmy.com/register?aff=HBVX建议您试试草莓云机场,可以流畅观看youtube和tiktok,上reddit/x也没有问题,还有各种ai优化节点。
-
-
-
想购买您这个站,我的联系方式QQ741756694微信同步 能卖联系
-
-
-
-
-
https://www.liuhaihua.cn/archives/40657.html 这篇博客中的图片打不开了
Loading...
![[HBLOG]公众号](https://www.liuhaihua.cn/img/qrcode_gzh.jpg)

