Linux性能分析
生产环境服务器变慢,诊断思路和性能评估
整机:top
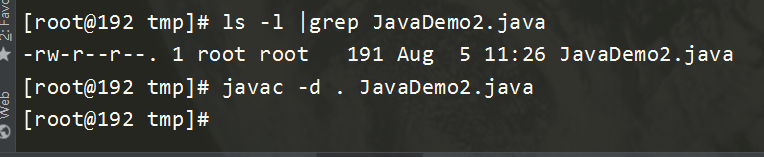
代码
public class JavaDemo2 {
    public static void main(String[] args) {
        while (true){
            System.out.println(new java.util.Random().nextInt(77778888));
        }
    }
}
top命令查看
[root@192 ~]# top
top - 11:28:50 up 7 min,  2 users,  load average: 0.73, 0.39, 0.18
Tasks: 230 total,   1 running, 229 sleeping,   0 stopped,   0 zombie
Cpu(s):  1.0%us,  2.3%sy,  0.0%ni, 96.7%id,  0.0%wa,  0.0%hi,  0.0%si,  0.0%st
Mem:   1906280k total,   649948k used,  1256332k free,    21164k buffers
Swap:  2097148k total,        0k used,  2097148k free,   203820k cached

   PID USER      PR  NI  VIRT  RES  SHR S %CPU %MEM    TIME+  COMMAND
  3672 root      20   0 3158m  94m  11m S 15.6  5.1   0:13.67 java
  3397 root      20   0  100m 5388 3396 S  9.3  0.3   0:09.00 sshd
    39 root      20   0     0    0    0 S  1.7  0.0   0:00.25 events/4
    37 root      20   0     0    0    0 S  1.0  0.0   0:00.39 events/2
    35 root      20   0     0    0    0 S  0.3  0.0   0:01.27 events/0
    36 root      20   0     0    0    0 S  0.3  0.0   0:00.34 events/1
    41 root      20   0     0    0    0 S  0.3  0.0   0:00.24 events/6
[root@192 ~]# uptime
11:29:09 up 7 min,  2 users,  load average: 0.52, 0.36, 0.18
CPU:vmstat
[root@192 ~]# vmstat -n 2  3
procs -----------memory---------- ---swap-- -----io---- --system-- -----cpu-----
 r  b   swpd   free   buff  cache   si   so    bi    bo   in   cs us sy id wa st
 0  0      0 1313028  21228 203868    0    0    54     3  112 1620  0  1 98  0  0
 0  0      0 1312732  21228 203896    0    0     0     0 2579 25940  1  3 96  0  0
 0  0      0 1312856  21228 203896    0    0     0     0 2677 24290  1  3 97  0  0
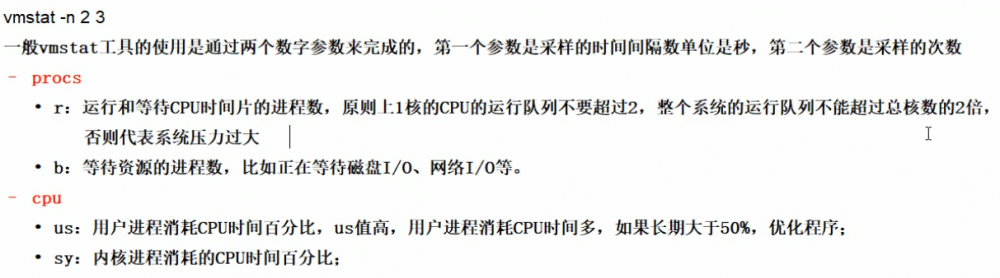
id:处于空闲的CPU百分比
wa:系统等待IO的CPU时间百分比
st:来自于一个虚拟机偷取的CPU时间百分比
查看额外的CPU信息
所有CPU核信息
[root@192 ~]# mpstat -P  ALL 2
Linux 2.6.32-642.el6.x86_64 (192.168.1.101)     08/05/2019      _x86_64_        (8 CPU)


11:42:40 AM  CPU    %usr   %nice    %sys %iowait    %irq   %soft  %steal  %guest   %idle
11:42:42 AM  all    1.07    0.00    2.89    0.00    0.00    0.00    0.00    0.00   96.04
11:42:42 AM    0    0.00    0.00    1.52    0.00    0.00    0.00    0.00    0.00   98.48
11:42:42 AM    1    6.09    0.00    9.14    0.00    0.00    0.00    0.00    0.00   84.77
11:42:42 AM    2    0.50    0.00    4.02    0.00    0.00    0.00    0.00    0.00   95.48
11:42:42 AM    3    1.00    0.00    2.00    0.00    0.00    0.00    0.00    0.00   97.00
每个进程使用CPU的用量分解信息
[root@192 ~]# pidstat -u 1 -p 3790
Linux 2.6.32-642.el6.x86_64 (192.168.1.101)     08/05/2019      _x86_64_        (8 CPU)

11:45:00 AM       PID    %usr %system  %guest    %CPU   CPU  Command
11:45:01 AM      3790    6.00   10.00    0.00   16.00     7  java
11:45:02 AM      3790    4.00   11.00    0.00   15.00     7  java
11:45:03 AM      3790    9.00   15.00    0.00   24.00     7  java
11:45:04 AM      3790    7.00   14.00    0.00   21.00     7  java
内存:free
应用程序可用内存数
推荐使用 free -m
[root@192 ~]# free -g
             total       used       free     shared    buffers     cached
Mem:             1          0          1          0          0          0
-/+ buffers/cache:          0          1
Swap:            1          0          1
[root@192 ~]# free -m
             total       used       free     shared    buffers     cached
Mem:          1861        553       1308          1         20        199
-/+ buffers/cache:        333       1528
Swap:         2047          0       2047

查看额外
[root@192 ~]# pidstat -p 3823 -r 2
Linux 2.6.32-642.el6.x86_64 (192.168.1.101)     08/05/2019      _x86_64_        (8 CPU)

11:51:16 AM       PID  minflt/s  majflt/s     VSZ    RSS   %MEM  Command
11:51:18 AM      3823      1.00      0.00 3234728  47068   2.47  java
11:51:20 AM      3823      2.50      0.00 3234728  47068   2.47  java
11:51:22 AM      3823      0.50      0.00 3234728  47068   2.47  java
11:51:24 AM      3823      2.50      0.00 3234728  47068   2.47  java
11:51:26 AM      3823      0.50      0.00 3234728  47068   2.47  java

硬盘:df
查看磁盘剩余空间
[root@192 ~]# df -h
Filesystem      Size  Used Avail Use% Mounted on
/dev/sda2        15G  5.6G  8.4G  41% /
tmpfs           931M   72K  931M   1% /dev/shm
/dev/sda1       190M   39M  142M  22% /boot
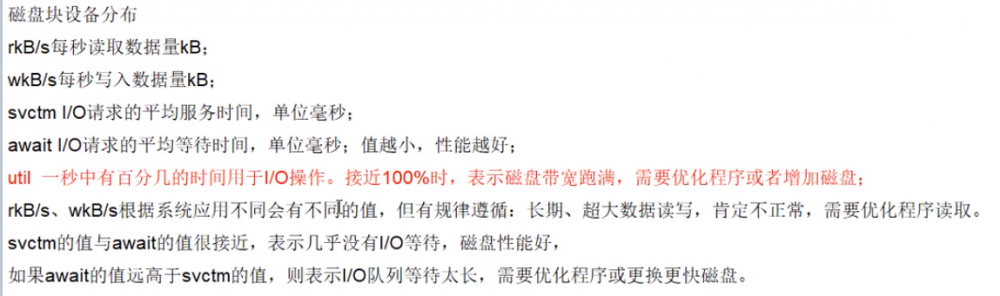
磁盘IO:iostat
[root@192 ~]# iostat -xdk 2 3
Linux 2.6.32-642.el6.x86_64 (192.168.1.101)     08/05/2019      _x86_64_        (8 CPU)

Device:         rrqm/s   wrqm/s     r/s     w/s    rkB/s    wkB/s avgrq-sz avgqu-sz   await r_await w_await  svctm  %util
scd0              0.00     0.00    0.38    0.00     1.50     0.00     8.00     0.00    0.67    0.67    0.00   0.67   0.03
sda              34.33     4.94   47.36    3.18  1631.23    32.44    65.84     0.07    1.38    1.22    3.72   0.88   4.43

Device:         rrqm/s   wrqm/s     r/s     w/s    rkB/s    wkB/s avgrq-sz avgqu-sz   await r_await w_await  svctm  %util
scd0              0.00     0.00    0.00    0.00     0.00     0.00     0.00     0.00    0.00    0.00    0.00   0.00   0.00
sda               0.00     0.00    0.50    0.00     4.00     0.00    16.00     0.00    1.00    1.00    0.00   1.00   0.05

Device:         rrqm/s   wrqm/s     r/s     w/s    rkB/s    wkB/s avgrq-sz avgqu-sz   await r_await w_await  svctm  %util
scd0              0.00     0.00    0.00    0.00     0.00     0.00     0.00     0.00    0.00    0.00    0.00   0.00   0.00
sda               0.00     0.00    0.00    0.00     0.00     0.00     0.00     0.00    0.00    0.00    0.00   0.00   0.00
查看额外
[root@192 ~]# pidstat -d 2 -p 3485
Linux 2.6.32-642.el6.x86_64 (192.168.1.101)     08/05/2019      _x86_64_        (8 CPU)

02:16:10 PM       PID   kB_rd/s   kB_wr/s kB_ccwr/s  Command
02:16:12 PM      3485      0.00      0.00      0.00  java
02:16:14 PM      3485      0.00      0.00      0.00  java
02:16:16 PM      3485      0.00      0.00      0.00  java
02:16:18 PM      3485      0.00      0.00      0.00  java
02:16:20 PM      3485      0.00      0.00      0.00  java
02:16:22 PM      3485      0.00      0.00      0.00  java
02:16:24 PM      3485      0.00      0.00      0.00  java

网络IO:ifstat
默认本地没有,需要下载ifstat
安装ifstat
[root@192 ifstat-1.1]# yum install flex byacc  libpcap ncurses ncurses-devel libpcap-devel gcc-c++
wget http://gael.roualland.free.fr/ifstat/ifstat-1.1.tar.gz
tar xzvf ifstat-1.1.tar.gz
cd ifstat-1.1
./configure
make
make install
[root@192 ifstat-1.1]# ifstat 1
       eth0
 KB/s in  KB/s out
    0.06      0.13
    0.06      0.12
    0.06      0.12
    0.06      0.12
    0.06      0.12
    0.06      0.12
    0.12      0.17
    0.06      0.12
生产环境出现CPU占用过高,分析思路和定位
public class JavaDemo2 {
    public static void main(String[] args) {
        while (true){
            System.out.println(new java.util.Random().nextInt(77778888));
        }
    }
}
先用top命令找出CPU占比最高的
PID USER      PR  NI  VIRT  RES  SHR S %CPU %MEM    TIME+  COMMAND
  4294 root      20   0 3158m  37m  11m S 16.6  2.0   0:03.28 java
  3428 root      20   0  100m 5444 3396 S 14.3  0.3   0:22.85 sshd
    35 root      20   0     0    0    0 S  1.0  0.0   0:03.18 events/0
    41 root      20   0     0    0    0 S  0.3  0.0   0:00.52 events/6
  2012 root      20   0  199m 5192 4288 S  0.3  0.3   0:00.32 ManagementAgent
     1 root      20   0 19344 1544 1228 S  0.0  0.1   0:01.83 init
     2 root      20   0     0    0    0 S  0.0  0.0   0:00.02 kthreadd
ps -ef或者jps进一步定位
[root@192 ifstat-1.1]# jps
4320 Jps
4294 JavaDemo2
定位到具体线程或者代码
[root@192 ifstat-1.1]# ps -mp 4294 -o THREAD,tid,time
USER     %CPU PRI SCNT WCHAN  USER SYSTEM    TID     TIME
root     18.6   -    - -         -      -      - 00:00:15
root      0.0  19    - futex_    -      -   4294 00:00:00
root     15.6  19    - n_tty_    -      -   4295 00:00:13
root      0.2  19    - futex_    -      -   4296 00:00:00
root      0.2  19    - futex_    -      -   4297 00:00:00
root      0.3  19    - futex_    -      -   4298 00:00:00
root      0.2  19    - futex_    -      -   4299 00:00:00
root      0.3  19    - futex_    -      -   4300 00:00:00
root      0.3  19    - futex_    -      -   4301 00:00:00
root      0.3  19    - futex_    -      -   4302 00:00:00
root      0.2  19    - futex_    -      -   4303 00:00:00
root      0.0  19    - futex_    -      -   4304 00:00:00
root      0.0  19    - futex_    -      -   4305 00:00:00
root      0.0  19    - futex_    -      -   4306 00:00:00
root      0.0  19    - futex_    -      -   4307 00:00:00
root      0.0  19    - futex_    -      -   4308 00:00:00
root      0.1  19    - futex_    -      -   4309 00:00:00
root      0.0  19    - futex_    -      -   4310 00:00:00
root      0.0  19    - futex_    -      -   4311 00:00:00
root      0.0  19    - futex_    -      -   4312 00:00:00
root      0.0  19    - futex_    -      -   4313 00:00:00
-m:显示所有的线程
-p: pid进程使用CPU的时间
-o:该参数后是用户自定义格式
线程ID转换为16进制格式(英文小写格式)
[root@192 ifstat-1.1]# printf "%x/n" 4295
10c7
jstack 进程ID|grep tid(16进制线程ID小写英文) -A60
[root@192 ifstat-1.1]# jstack 4294 | grep 10c7 -A60
"main" #1 prio=5 os_prio=0 tid=0x00007f7f68009000 nid=0x10c7 runnable [0x00007f7f6f117000]
   java.lang.Thread.State: RUNNABLE
        at java.io.FileOutputStream.writeBytes(Native Method)
        at java.io.FileOutputStream.write(FileOutputStream.java:326)
        at java.io.BufferedOutputStream.flushBuffer(BufferedOutputStream.java:82)
        at java.io.BufferedOutputStream.flush(BufferedOutputStream.java:140)
        - locked <0x00000000e2e0e6e0> (a java.io.BufferedOutputStream)
        at java.io.PrintStream.write(PrintStream.java:482)
        - locked <0x00000000e2e0bbd8> (a java.io.PrintStream)
        at sun.nio.cs.StreamEncoder.writeBytes(StreamEncoder.java:221)
        at sun.nio.cs.StreamEncoder.implFlushBuffer(StreamEncoder.java:291)
        at sun.nio.cs.StreamEncoder.flushBuffer(StreamEncoder.java:104)
        - locked <0x00000000e2e0e800> (a java.io.OutputStreamWriter)
        at java.io.OutputStreamWriter.flushBuffer(OutputStreamWriter.java:185)
        at java.io.PrintStream.newLine(PrintStream.java:546)
        - eliminated <0x00000000e2e0bbd8> (a java.io.PrintStream)
        at java.io.PrintStream.println(PrintStream.java:737)
        - locked <0x00000000e2e0bbd8> (a java.io.PrintStream)
        at JavaDemo2.main(JavaDemo2.java:4)

"VM Thread" os_prio=0 tid=0x00007f7f68080000 nid=0x10d0 runnable

"GC task thread#0 (ParallelGC)" os_prio=0 tid=0x00007f7f6801e800 nid=0x10c8 runnable

"GC task thread#1 (ParallelGC)" os_prio=0 tid=0x00007f7f68020000 nid=0x10c9 runnable

"GC task thread#2 (ParallelGC)" os_prio=0 tid=0x00007f7f68022000 nid=0x10ca runnable

"GC task thread#3 (ParallelGC)" os_prio=0 tid=0x00007f7f68024000 nid=0x10cb runnable

"GC task thread#4 (ParallelGC)" os_prio=0 tid=0x00007f7f68025800 nid=0x10cc runnable

"GC task thread#5 (ParallelGC)" os_prio=0 tid=0x00007f7f68027800 nid=0x10cd runnable

"GC task thread#6 (ParallelGC)" os_prio=0 tid=0x00007f7f68029800 nid=0x10ce runnable

"GC task thread#7 (ParallelGC)" os_prio=0 tid=0x00007f7f6802b000 nid=0x10cf runnable

"VM Periodic Task Thread" os_prio=0 tid=0x00007f7f680e8000 nid=0x10d9 waiting on condition

JNI global references: 5
参考
找到最耗CPU的java线程 - - ITeye博客
本文由博客一文多发平台 OpenWrite 发布!
正文到此结束
热门推荐


相关文章

近期评论
-
ws0132613@gmail.comhttps://getmacos.com/gopanel/william smith
-
谢谢
-
https://www.newcmy.com/register?aff=HBVX建议您试试草莓云机场,可以流畅观看youtube和tiktok,上reddit/x也没有问题,还有各种ai优化节点。
-
-
-
想购买您这个站,我的联系方式QQ741756694微信同步 能卖联系
-
-
-
-
Loading...
![[HBLOG]公众号](https://www.liuhaihua.cn/img/qrcode_gzh.jpg)

