SpringCloud- 第五篇 Hystrix快速上手(二)
1:SpringCloud中使用:
1.1:加入依赖
<dependency>
    <groupId>org.springframework.cloud</groupId>
    <artifactId>spring-cloud-starter-hystrix</artifactId>
</dependency>
<dependency>
    <groupId>org.springframework.boot</groupId>
    <artifactId>spring-boot-starter-actuator</artifactId>
</dependency>
<dependency>
    <groupId>org.springframework.cloud</groupId>
    <artifactId>spring-cloud-starter-hystrix-dashboard</artifactId>
</dependency>
1.2:启动类上添加
@SpringBootApplication
@EnableHystrixDashboard
@EnableCircuitBreaker
//@EnableHystrix
1.3:Controller上配置
在Controller的方法上添加Hystrix的配置,形如:
@HystrixCommand(fallbackMethod = "error", commandProperties = {
            @HystrixProperty(name="execution.isolation.strategy", value = "THREAD"),
            @HystrixProperty(name = "execution.isolation.thread.timeoutInMilliseconds", value = "4000"),
            @HystrixProperty(name = "circuitBreaker.requestVolumeThreshold", value = "10"),
            @HystrixProperty(name = "circuitBreaker.errorThresholdPercentage", value = ”50")
    }, threadPoolProperties = {
            @HystrixProperty(name = "coreSize", value = "1"),
            @HystrixProperty(name = "maxQueueSize", value = "10"),
            @HystrixProperty(name = "keepAliveTimeMinutes", value = "1000"),
            @HystrixProperty(name = "queueSizeRejectionThreshold", value = "8"),
            @HystrixProperty(name = "metrics.rollingStats.numBuckets", value = "12"),
            @HystrixProperty(name = "metrics.rollingStats.timeInMilliseconds", value = "1500")
    })
Hystrix支持两种方式定义HystrixCommand,一种是将类继承自HystrixCommand类,重写run方法,另一种是在方法头上写注解的方式,使用注解的方式代码会比较清晰,将Hystrix代码和业务代码隔离开
2: DashBoard
2.1: 概述
Hystrix自带了DashBoard,如果监控单个实例,可以很方便的通过Hystrix的dashboard进行查看运行情况,直接进入 http://localhost :8080/hystrix
Hystrix Dashboard共支持三种不同的监控方式,依次为:
- 1:默认的集群监控:通过URL http://turbine-hostname :port/turbine.stream开启,实现对默认集群的监控。
- 2:指定的集群监控:通过URL http://turbine-hostname :port/turbine.stream?cluster=[clusterName]开启,实现对clusterName集群的监控。
- 3:单体应用的监控:通过URL http://hystrix-app :port/hystrix.stream开启,实现对具体某个服务实例的监控。
前两者都对集群的监控,需要整合Turbine才能实现
2.2: 示例如下
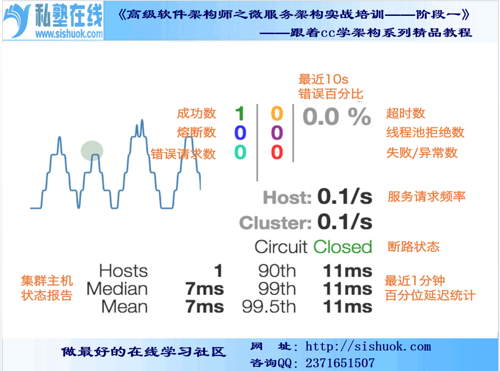
- Delay:该参数用来控制服务器上轮询监控信息的延迟时间,默认为2000毫秒,可以通过配置该属性来降低客户端的网络和CPU消耗。
- Title:该参数对应了头部标题Hystrix Stream之后的内容,默认会使用具体监控实例的URL,可以通过配置该信息来展示更合适的标题。
- 监控信息的左上部分找到两个重要的图形信息:一个实心圆和一条曲线。
(1)实心圆:共有两种含义。它通过颜色的变化代表了实例的健康程度,它的健康度从绿色、黄色、橙色、红色递减。该实心圆除了颜色的变化之外,它的大小也会根据实例的请求流量发生变化,流量越大该实心圆就越大。所以通过该实心圆的展示,就可以在大量的实例中快速的发现故障实例和高压力实例。
(2)曲线:用来记录2分钟内流量的相对变化,可以通过它来观察到流量的上升和下降趋势。
正文到此结束
热门推荐


相关文章


Loading...
![[HBLOG]公众号](https://www.liuhaihua.cn/img/qrcode_gzh.jpg)

