使用 Grafana+collectd+InfluxDB 打造现代监控系统
想打造 New Relic 那样漂亮的实时监控系统我们只需要 InfluxDB/collectd/Grafana 这三个工具,这三个工具的关系是这样的:
采集数据(collectd)-> 存储数据(InfluxDB) -> 显示数据(Grafana)。
- InfluxDB 是 Go 语言开发的一个开源分布式时序数据库,非常适合存储指标、事件、分析等数据,看版本号(v0.8.8)就知道这个项目还很年轻;
- collectd 就不用介绍了吧,C 语言写的一个系统性能采集工具;
- Grafana 是纯 Javascript 开发的前端工具,用于访问 InfluxDB,自定义报表、显示图表等。
下面的安装和配置步骤在 Ubuntu 14.04 Server 64bit 版上完成。升级整个系统后重启:
$ sudo apt-get update $ sudo apt-get upgrade $ sudo reboot
安装 InfluxDB
InfluxDB 是 Go 写的,不依赖任何其他包或库,很干净。安装很容易:
$ wget https://s3.amazonaws.com/influxdb/influxdb_latest_amd64.deb $ sudo dpkg -i influxdb_latest_amd64.deb
启动 InfluxDB:
$ sudo /etc/init.d/influxdb start Setting ulimit -n 65536 Starting the process influxdb [ OK ] influxdb process was started [ OK ]
启动后打开 web 管理界面 http://192.168.2.183:8083/ 默认用户名和密码是 root 和 root. InfluxDB 的 Web 管理界面端口是 8083,HTTP API 监听端口是 8086,如果需要更改这些默认设定,修改 InfluxDB 的配置文件 /opt/influxdb/current/config.toml 后重启 InfluxDB 就可以了。

在刚安装好的 InfluxDB 上创建一个名为 collectd 的数据库,可以用命令行创建,也可以用 Web 管理界面操作:
$ curl "http://192.168.2.183:8086/db?u=root&p=root" -d "{/"name/": /"collectd/"}" 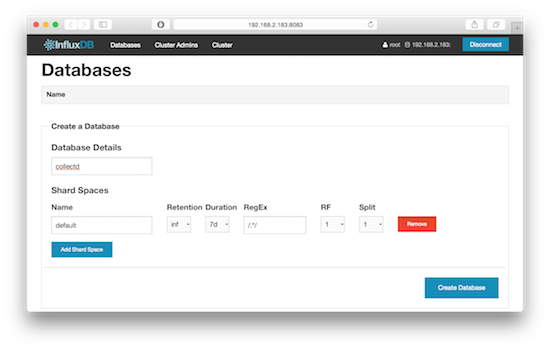
安装 collectd
安装 collectd:
$ sudo apt-get install collectd
配置 collectd 为客户端,收集到数据后直接发给 InfluxDB:
$ sudo vi /etc/collectd/collectd.conf ... LoadPlugin network ... <Plugin network> Server "192.168.2.183" "25826" </Plugin> ...
重启 collectd:
$ sudo /etc/init.d/collectd restart
InfluxDB 现在自带一个 collectd 插件来获取 collectd 客户端发来的数据,以前可没这么方便哦,0.8.4 版本以前只能通过 influxdb-collectd-proxy 这样的第三方程序来连接 collectd 和 InfluxDB.
InfluxDB 自带的 collectd 插件默认是关闭的,需要手动配置打开 enabled = true,并填上 database = “collectd” 这一行,这里的 “collectd” 就是我们上面创建的那个数据库,更改配置后记得重启 InfluxDB:
$ sudo vi /opt/influxdb/shared/config.toml ... # Configure the collectd api [input_plugins.collectd] enabled = true address = "0.0.0.0" # If not set, is actually set to bind-address. port = 25826 database = "collectd" # types.db can be found in a collectd installation or on github: # https://github.com/collectd/collectd/blob/master/src/types.db typesdb = "/usr/share/collectd/types.db" # The path to the collectd types.db file ... $ sudo /etc/init.d/influxdb restart Setting ulimit -n 65536 Setting ulimit -n 65536 influxdb process was stopped [ OK ] Setting ulimit -n 65536 Starting the process influxdb [ OK ] influxdb process was started [ OK ]
现在 InfluxDB 已经准备好接受和处理 collectd 传来的数据了。用命令行或者 Web 管理界面验证一下数据库里是否有数据:
$ curl -G 'http://192.168.2.183:8086/db/collectd/series?u=root&p=root&q=list+series&pretty=true' [ { "name": "list_series_result", "columns": [ "time", "name" ], "points": [ [ 0, "192.168.2.183/cpu-0/cpu-idle" ], ... ] } ] 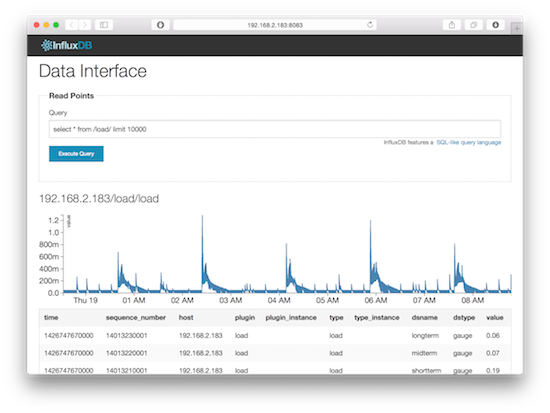
安装 Grafana
下载 grafana 后解压发到 web 服务器上就可用。这里省去配置 Nginx/Apache 之类的麻烦,直接用最简单的 Web 服务器 python -m SimpleHTTPServer 驱动:
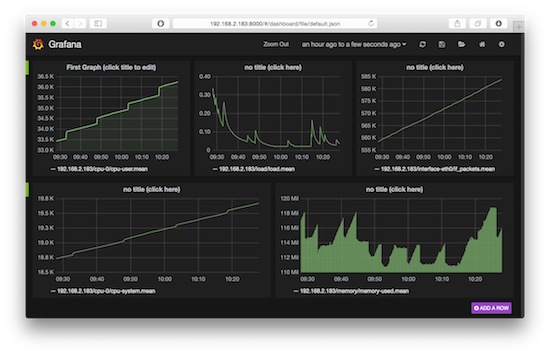
$ wget http://grafanarel.s3.amazonaws.com/grafana-1.9.1.tar.gz $ tar xzvf grafana-1.9.1.tar.gz $ cd grafana-1.9.1.tar.gz $ cp config.sample.js config.js $ vi config.js ... // InfluxDB example setup (the InfluxDB databases specified need to exist) datasources: { influxdb: { type: 'influxdb', url: "http://192.168.2.183:8086/db/collectd", username: 'root', password: 'root', }, ... }, ... $ sudo python -m SimpleHTTPServer 用浏览器访问 Grafana,这里的默认端口是 8000:
正文到此结束
热门推荐


相关文章

近期评论
-
ws0132613@gmail.comhttps://getmacos.com/gopanel/william smith
-
谢谢
-
https://www.newcmy.com/register?aff=HBVX建议您试试草莓云机场,可以流畅观看youtube和tiktok,上reddit/x也没有问题,还有各种ai优化节点。
-
-
-
想购买您这个站,我的联系方式QQ741756694微信同步 能卖联系
-
-
-
-
Loading...
![[HBLOG]公众号](https://www.liuhaihua.cn/img/qrcode_gzh.jpg)

