(4/4)Java 垃圾回收监控和分析工具
Java Garbage Collection Monitoring and Analysis
https://javapapers.com/java/j...
In this Java garbage collection tutorial series let us look about the tools available for garbage collection monitoring and analysis. Then use a tool and monitor an example Java application for garbage collection process. If you are a beginner it is better for you to go through this series of tutorials. You can start with introduction for Java garbage collection.
在这个 Java 垃圾回收系列教程当中,我们现在看看有哪些可以用来监控和分析垃圾回收的工具,然后我们用它来监控一个 Java 应用的垃圾回收过程。如果你是一个初学者,建议你完整的阅读一遍本教程,从Java 垃圾回收介绍开始。
Java Garbage collection monitoring and analysis tools
Java 垃圾回收监控和分析工具
Following are some of the tools available. Each of these following tools have their own advantages and disadvantages. We can improve performance of an application by choosing the right tool and doing the analysis in an organized manner. For this tutorial, let us go with the Java VisualVM.
下面是可以用到的一些工具,每样工具都有自己的优缺点。我们可以通过选择正确的工具、进行有序地分析工作来提升应用的性能。本文将以 Java VisualVM 为例。
- Java VisualVM
- Naarad
- GCViewer
- IBM Pattern Modeling and Analysis Tool for Java Garbage Collector
- HPjmeter
- IBM Monitoring and Diagnostic Tools for Java – Garbage Collection and Memory
- Visualizer
- Verbose GC Analyzer
Java VisualVM
Java VisualVM is available with the Java SE SDK installation for free. Just have a look at the bin folder of your Java JDK installation. Javajdk1.8.0bin is the path. There are many other tools available along with the javac and java tools. jvisualvm is one among them.
Java VisualVM 是随着 Java SE SDK 一起免费安装的,其启动路径为 /Java/jdk1.8.0/bin ,它是随着 javac 和其他 java 工具一起提供的众多工具之一。(译注:现已不再如此,读者可以访问 官方网站 下载 VisualVM。)
Java VisualVM provides information about running Java applications with a visual interface. It is many tool bundled into one. Tools like JConsole, jstat, jinfo, jstack, and jmap are now part of Java VisualVM.
Java VisualVM 以可视化界面的方式展示了正在运行的 Java 应用信息,它也是一组相关的工具的集合,比如 JConsole、jstat、jinfo、jstack 和 jmap,这些都是 Java VisualVM 的一部分。
Java VisualVM can be used to
Java VisualVM 的功能包括:
- generate and analyze heap memory dumps
生成和分析堆内存快照; - view and operate on MBeans
对 MBeans 进行查看和操作; - monitor garbage collection
监视垃圾收集; - memory and CPU profiling
剖析内存和 CPU 表现。
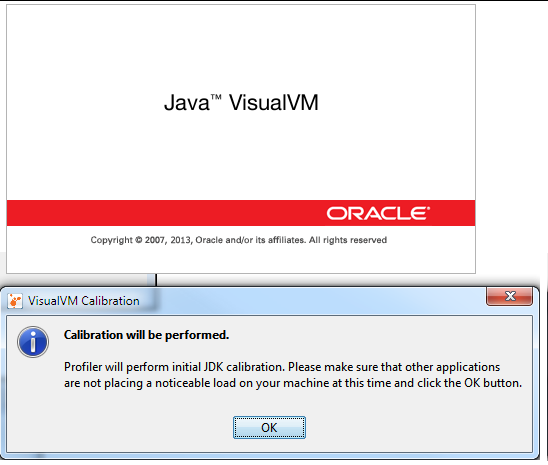
1. Launch VisualVM 启动 Visual VM
jvisualvm is available in bin fold of JDK.
jvisualvm 可以在 JDK 的 bin 文件夹中找到。(译注:现已不再如此,读者可以访问 官方网站 下载)

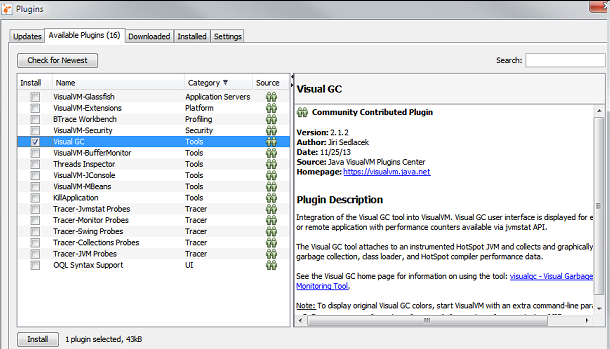
2. Install Visual GC Plugin 安装 Visual GC 插件
We need to install a visual GC plugin have a nice and worthy visual feel of the Java GC process.
如果想要方便舒适的查看 Java GC 过程,我们需要安装 visual GC 插件。
3. Monitor GC 监视 GC
Now its time to monitor the garbage collection process. Start your Java application and it will be auto detected and shown in the Java VisualVM interface. In the left side “Applications” pane under the “Local” node, all the locally running Java applications will be listed.
这样我们就可以监视 GC 过程了。启动你的 Java 应用后,Java VisualVM 就应该能自动检测到它。所有本地运行的 Java 应用都会在左边“Applications”面板的“Local”节点下面列出来。
Java VisualVM is a Java application and so it will also me listed in it. For tutorial purpose we will monitory the GC process for the VisualVM application itself.
因为 Java VisualVM 自身也是 Java 应用,所以它也把自己列出来了。作为演示,我们就来监视 VisualVM 自身的 GC 过程。
Double click the VisualVM icon shown below the “Local” node.
在“Local”节点下,双击 VisualVM 图标。
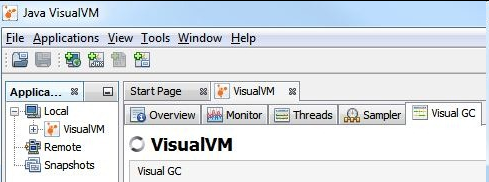
Now the application monitoring pane is open on the right side. There are different tabs to show each of the performance related monitoring aspects of the application. As of now our interest is on “Visual GC” and lets click it.
这样在右边就打开了该应用的监视面板,面板中展示了用于监视性能相关的多个标签页。在本例子中,我们点击切换到“Visual GC”标签页。
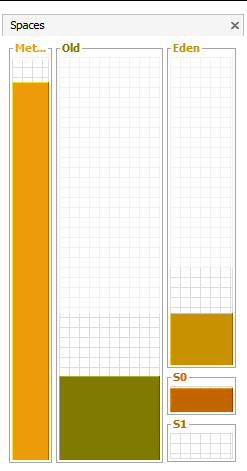
Above image show the memory spaces utilization for Old, Eden, S0 and S1 spaces. Following graphs shows each segment wise detail allocation and de-allocation of memory space. It keeps updating at defined refresh rate.
上图展示了内存中 Old、Eden、S0 和 S1 区间的使用情况。下图展示了每个区间的内存分配和回收的变化情况,它会按照固定的频率刷新。
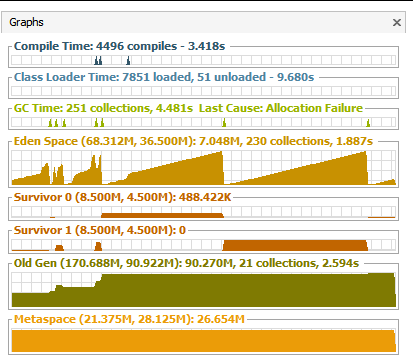
The above shown graphs are for a normally behaving application. When there is a memory leak or any abnormal behaviour it will explicitly evident from the graph itself. To the least we can understand that there is an issue related to object memory allocation and garbage collection. Then with the help of other tabs like “Threads” and with Thread Dump we can narrow down the issue.
上面我们看到的是一个正常的应用所应有的表现。如果出现了内存泄漏或其他任何不正常的行为,我们将能从图表中能找到清晰的证据,至少能得知这个应用在内存分配和垃圾回收方面出现了问题。接下来在其他标签页,比如“Threads(线程)”的帮助下,我们能进一步缩小问题的范围。
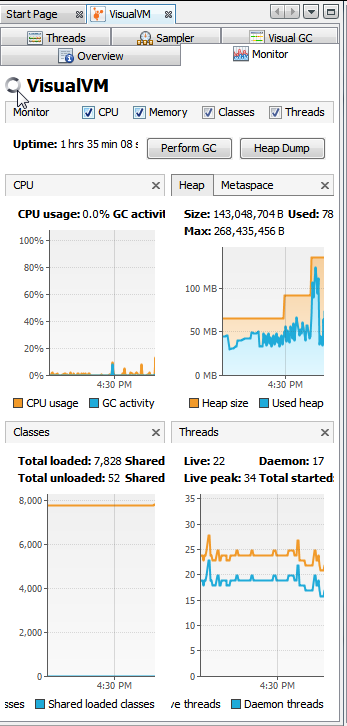
In the “Monitor” tab we can monitor overall Heap memory utilization as a timer series graph. We have got “Perform GC” button to initiate the garbage collection process.
在“Monitor”标签页中,我们可以以时间轴图表的方式监视堆内存的整体使用情况。这里还有一个“Perform GC”按钮,用来启动一次垃圾回收过程。
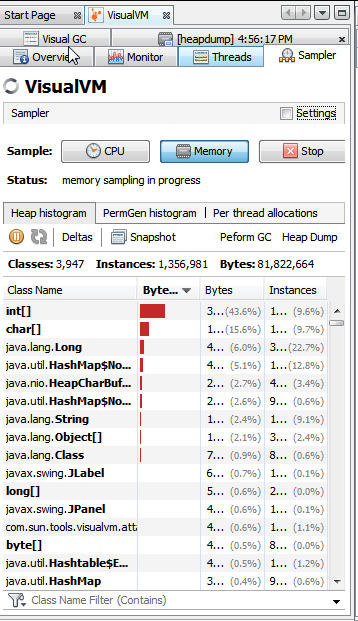
In the “Sampler” tab we can start the memory and CPU profiling process. It will show detailed live report for each instance wise utilization. It will help to nail down the performance problem.
在“Sampler”标签页中,我们可以对 CPU 和内存进行剖析。该标签页会以用户选择的维度来展示实时的使用情况报告。它可以用来帮助定位性能方面的问题。
With this tutorial, we have come to the end of the four part Java garbage collection tutorial series.
这个 四部分的 Java 垃圾回收系列教程 至此结束。
正文到此结束
热门推荐


相关文章


Loading...
![[HBLOG]公众号](http://www.liuhaihua.cn/img/qrcode_gzh.jpg)

